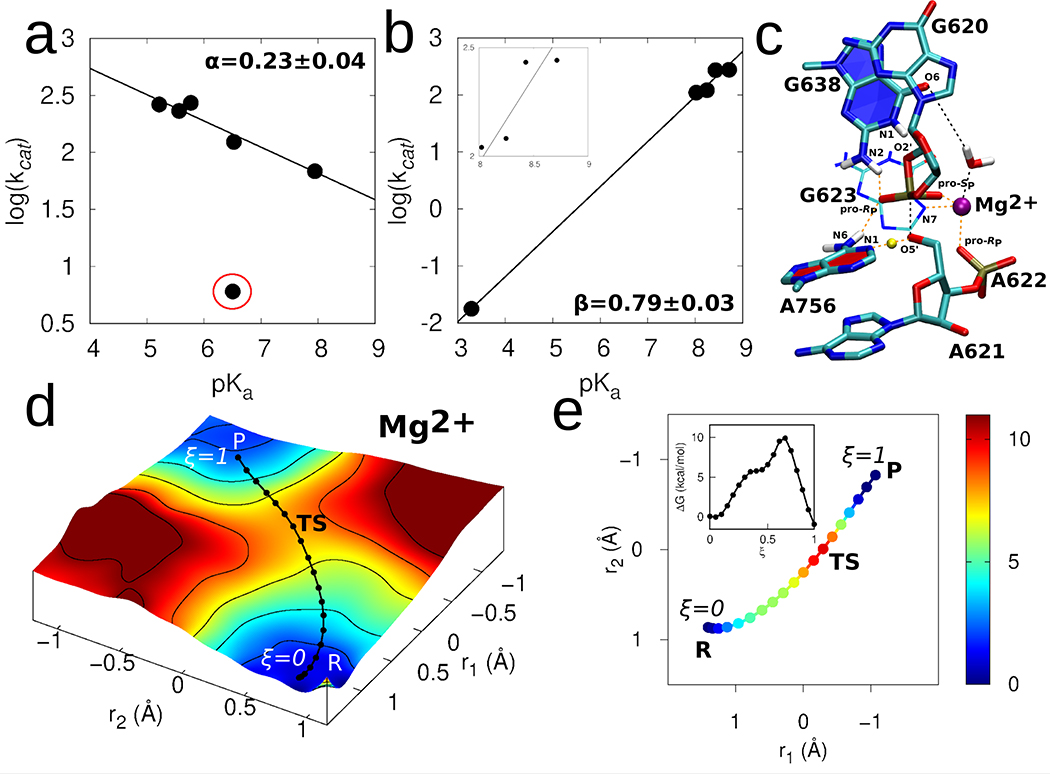
Figure 3. Catalytic mechanism of the VS ribozyme.
(a) Brønsted plot for VS ribozymes with A756 analogs. kcat and pKa values were determined through fitting pH-profiles (Supplementary Figure 6 to a model for double ionization. For all A analogs, the lower pKa was assumed to correspond to the general acid (A756 in wild type ribozyme). The data (excluding the outlier 3cP mutant) were fit linearly to reveal a slope = 0.23 ± 0.04. (b) Brønsted plot for VS ribozymes with G638 analogs. kcat and pKa values were determined through fitting pH-profiles (Supplementary Figure 7) to a model for double ionization with the exception of the G638P* substrate, which was fit to a model for single ionization. For all G analogs, the higher pKa was assumed to correspond to the general base (G638 in wild type ribozyme). The pKa of P* (3.3) was inferred from titration of the nucleoside in solution. The linear fitting of the resulting plot revealed a slope of 0.79 ± 0.03. The inset in (b) zooms into the datapoints that falls in the pKa range 8–9. The linear fitting of only these datapoints and excluding the datapoint corresponding to P* (at 3.3) results in a slope of 0.67 ± 0.04. (c) 3D structure of representative transition state geometry along the reaction pathway obtained in presence of the active site Mg2+ ion. (d) The 2D free energy surface underlying the catalytic reaction obtained using ab initio QM/MM umbrella sampling simulations. The solid black line corresponds to the converged pathway obtained using FTS simulations. (e) Converged pathway obtained from the FTS simulations in presence of active site Mg2+ ion. In (d) and (e), reaction coordinate r1 corresponds to the phosphorus bond breaking/forming coordinate represented by the difference between the A621:P-G620:O2’ and A621:P-A621:O5’ distances, and r2 corresponds to the general acid proton transfer coordinate represented by the difference between the A756:N1-A756:H1 and A621:O5’-A756:H1 distances. The color scale denotes relative free energy values in units of kcal/mol. Inset in (e) shows the 1D free energy profile of the pathway obtained in presence of the active site Mg2+ ion.

