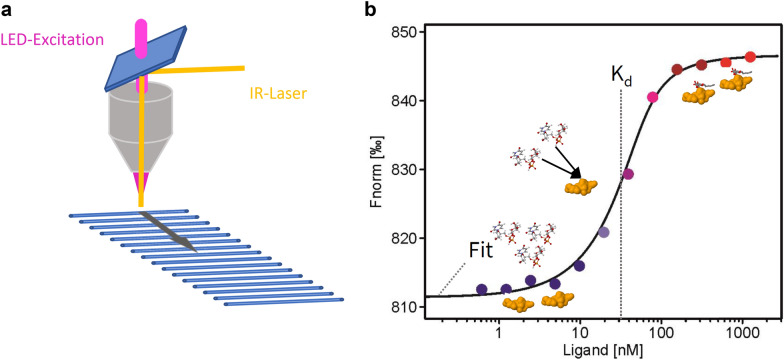
Fig. 1.
Setup of the apparatus to determine the thermophoresis of biomolecules. a An infrared (IR) laser heats the aqueous sample filled in a thin glass capillary and generates a localized microscopic temperature gradient in the range of 2–6 °C. Protein complexes with interaction partners demonstrate slower movement through the temperature gradient compared with free molecules. This movement is monitored via fluorescence of the target protein. Rapid scanning of 16 capillaries loaded with fluorescent target protein at a constant concentration and substrates in increasing concentration gradients enables the determination of equilibrium binding constants. b A binding curve can be calculated from the gradual difference of thermophoresis between the fluorescent molecules of both unbound and bound states, which is plotted as Fnorm, defined as Fhot/Fcold against the ligand concentration. The binding constant Kd can be then derived from the binding curve

