Fig. 2.
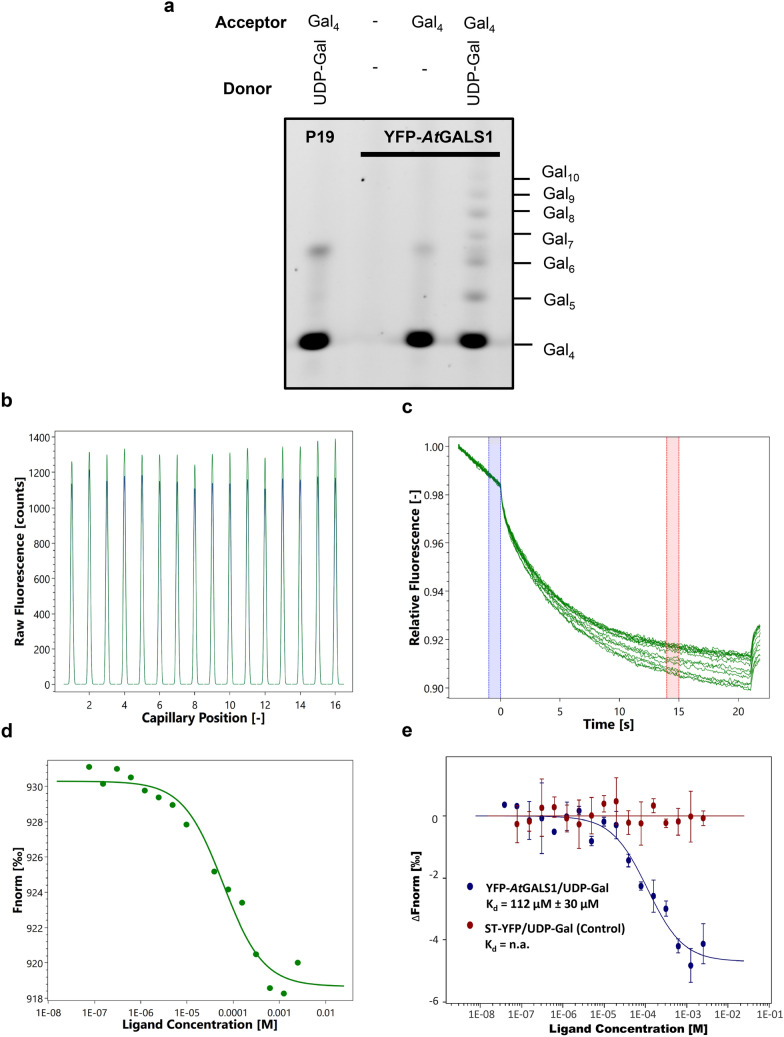
Substrate binding assay of AtGALS1. a Activity analysis of AtGASL1 using carbohydrate gel electrophoresis (PACE). Incubation of YFP-AtGALS1 microsomes and ANTS-labeled β-1,4-galactotetraose (Gal4) in the presence and absence of 200 μM UDP-Gal displayed activity of catalyzing the elongation of galactan backbone. No activity was observed in the p19 control. b Initial fluorescence counts of YFP-AtGALS1 microsomes in MES buffer at different concentrations of UDP-Gal. The variation in fluorescence across the concentration gradients is within the tolerance range (± 10%). c Thermographs of YFP-AtGALS1 binding to UDP-Gal provide well-defined curves. The blue region at 0 s indicates cold spot before the temperature gradient was applied, and the red region at 15 s shows the hot spot during the thermophoresis. d Dose–response curve for the binding interaction between YFP-AtGALS1 and UDP-Gal by plotting Fnorm against the ligand concentration. The binding curve yields a Kd of 101 μM. e Normalized binding curve of YFP-AtGALS1 and ST-YFP control in presence of UDP-Gal. The binding curve yields a Kd of 112 ± 30 μM. Concentration of YFP-AtGALS1 or ST-YFP were kept constant while the UDP-Gal concentration varied from 2.5 mM to 76.3 nM. Data were fitted to Kd model and confidence interval of the Kd is calculated from the variance of the fitted parameter, derived from Levenberg–Marquardt fit-algorithm. Error Bar: SD, n = 3. Values are the average ± 68% confidence

