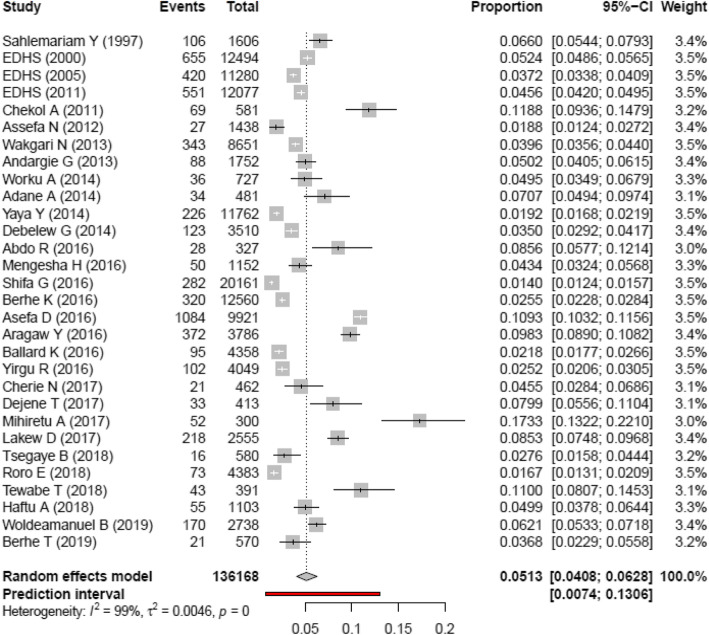
Fig. 2.
Forest plot showing heterogeneity among included studies to estimate perinatal mortality rate, 1997–2019, Ethiopia. In Fig. 2: Each squared box indicates the sample size of individual studies. The horizontal line at the middle of each box indicates the 95% confidence interval of individual studies. The dot at the middle of the squared box and the horizontal line indicates the effect size (PMR) of individual studies. The long horizontal line inside the squared box which is wider than the squared box indicates the sample size is smaller than expected. The diamond shape at the end of the broken vertical line indicates the pooled effect size (pooled PMR). The red color horizontal line shows the prediction interval. The boxes at the left side of the broken vertical line show the effect sizes of individual studies that are lower than the pooled effect size and vice versa

