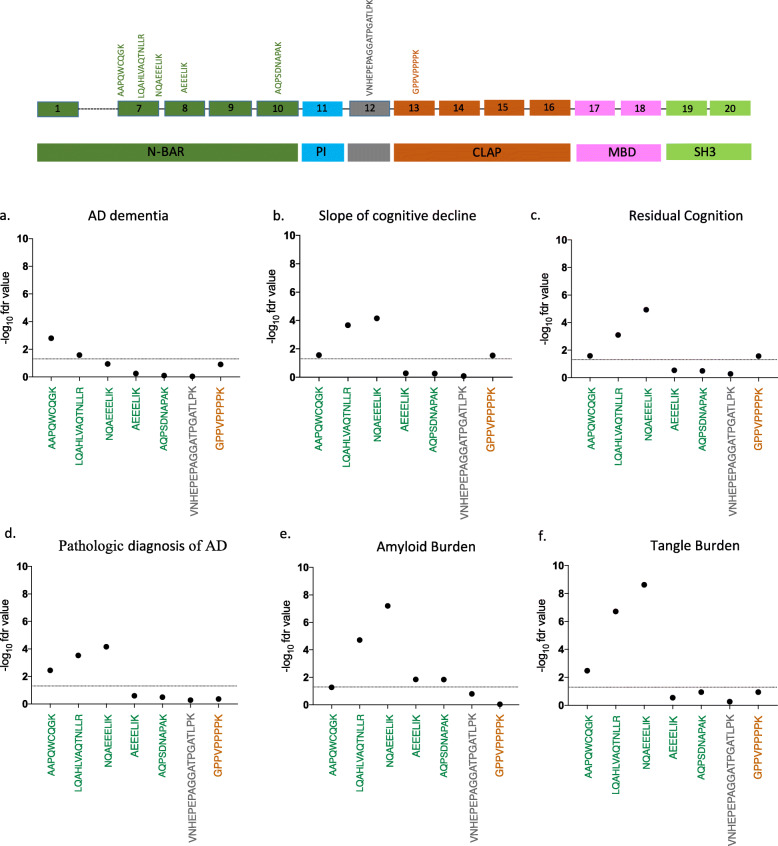
Fig. 4.
Quantitative analyses of BIN1 peptides in dorsolateral prefrontal cortex (DLPFC). The location and sequence of tested BIN1 peptides is shown in the diagram at the top of the figure. Peptides are colored based on the functional domains of the protein. a-f The abundance of each of the 7 peptides from 3 different domains of BIN1 was tested for association with different AD- related pathology traits in human DLPFC using SRM proteomics. The threshold of significance is reported on the Y-axis and is denoted by the horizontal dashed line as the -log of the False Discovery Rate (FDR) value (FDR < 0.05)

