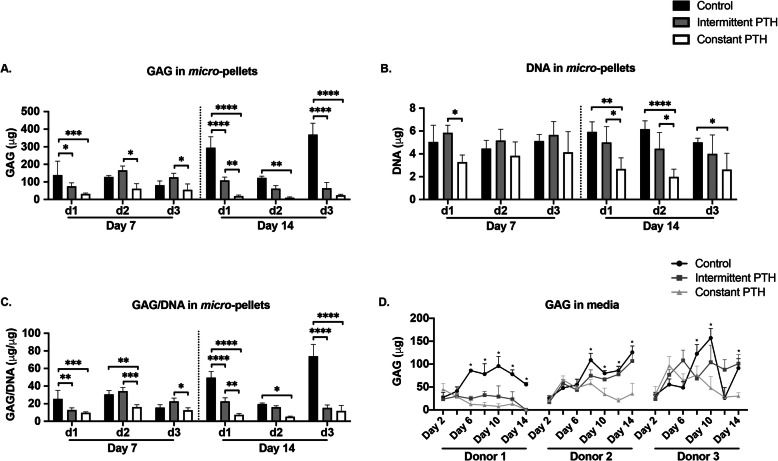
Fig. 3.
Quantification of GAG and DNA in micro-pellet cultures generated from three BMSC donors. a Quantities of GAG in micro-pellets at day 7 and day 14. b DNA quantities in micro-pellets at day 7 and day 14. c GAG normalised to DNA in micro-pellets. d Quantification of GAG secreted to the media by micro-pellets over a 14-day culture period. For a–c, data represent mean ± SD, n = 4, *P < 0.05, **P < 0.01, ***P < 0.001, and ****P < 0.0001. For d, data represent mean ± SD, n = 6, a single asterisk is used for all levels of significance when P < 0.05

