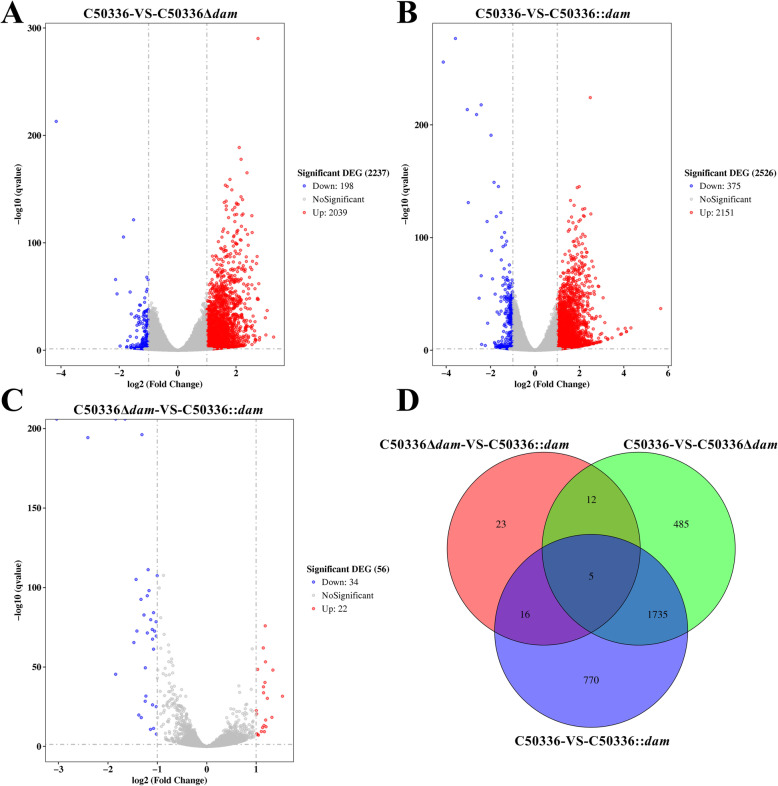
Fig. 7.
Differentially expressed genes (DEGs) between J774A.1 cells infected with SE. J774A.1 cells were pre-treated with LPS (1 μg/mL, 5 h) and then infected with C50336, C50336Δdam, or C50336::dam (cultured with IPTG) at an MOI of 20 for 4 h. Each group comprised three independent replicates. The cells were then collected, and the total RNA was isolated for RNA sequencing. Volcano plot of all DEGs between the C50336-infected group and the C50336Δdam-infected group a, the C50336-infected group and the C50336::dam-infected group b, and the C50336Δdam-infected group and the C50336::dam-infected group c. Genes with log2 (fold change) ≤ − 1 and p-value < 0.05 are marked with blue dots, and genes with log2 (fold change) ≥ 1 and p-value < 0.05 are marked with red dots. d. Venn diagram displaying the number of overlapping DEGs in J774A.1 cells infected with different SE

