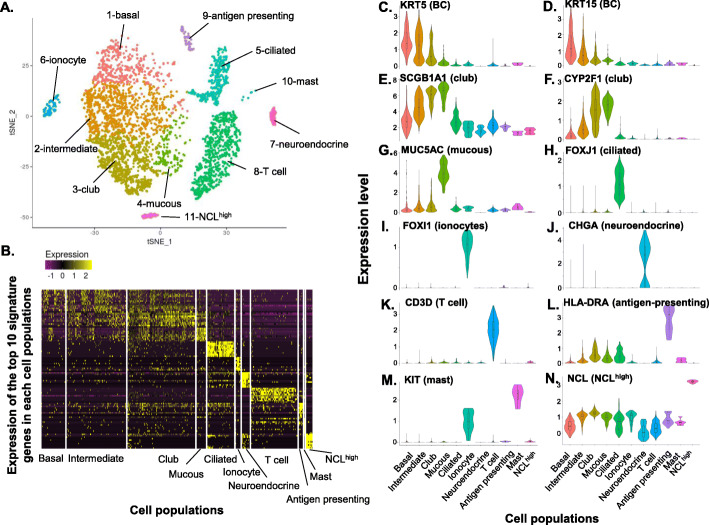
Fig. 1.
Single-cell RNA sequencing identification of 11 unique cell populations recovered by bronchoscopy and brushing of the nonsmoker human small airway epithelium (SAE). Drop-seq-based single-cell RNA sequencing was performed on cells recovered from 3 healthy nonsmokers; 4275 cells passed quality control filtering. a Unsupervised t-distributed Stochastic Neighbor Embedding (t-SNE) clustering. Based on signature genes (Supplemental Tables S2, S3, and S4) and known markers for these cell populations, these 11 cell populations were defined as: (1) basal cells; (2) intermediate cells; (3) club cells; (4) mucous cells; (5) ciliated cells; (6) ionocytes; (7) neuroendocrine cells; (8) T cells; (9) antigen presenting cells; (10) mast cells; and (11) unidentified NCLhigh cells. The cell populations were identified in all 3 individuals, except: mast cells (population 10), observed in 2 of the 3 individuals; and neuroendocrine cells and the NCLhigh cell population, which were identified in only one individual. b Heatmap plot displaying the expression of the top 10 signature genes from all 11 cell populations identified in panel a. The signature genes for each cell population are listed in Supplemental Tables S2, S3, and S4. c-n Violin plots of the markers for different cell types in the cells populations identified in panel a The violin plots were constructed with imputed data. c. KRT5 (p = 4.7 × 10− 41), basal cell; d KRT15 (p = 9.9 × 10− 62), basal cell; e. SCGB1A1 (p = 4.0 × 10− 179), club cells; f CYP2F1 (p = 8.6 × 10− 183), club cells; g MUC5AC (p = 1.1 × 10− 146), mucous cells; h FOXJ1 (p = 1.9 × 10− 164), ciliated cells; i FOXI1 (p = 3.5 × 10− 52), ionocytes; j CHGA (p = 6.3 × 10− 142), neuroendocrine cells; k CD3D (p = 1.5 × 10− 291), T cells; l HLA-DRA (p = 9.7 × 10− 130), MHC class II, antigen presenting cells; m KIT (p = 5.5 × 10− 4), mast cells; and n NCL (p = 3.5 × 10− 161). The p values, adjusted by Bonferroni correction, were generated by comparison of the indicated cell population vs all other cells in the total population (see Supplemental Table S2)

