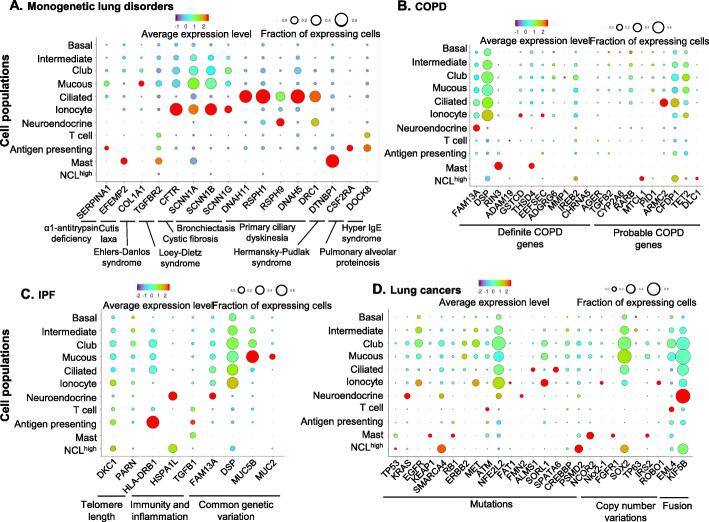
Fig. 2.
Dot plots of expression of specific small airway cell genes associated with lung disorders. a Monogenic lung disorder genes (see Supplemental Figure S3 for the full gene list). b Genes related to COPD identified by COPD genome-wide association studies (GWAS) or exome chip and GWAS of COPD-related phenotypes (http://www.copdgene.org). Shown are definite COPD risk genes (left) and probable COPD risk genes (right). The COPD-related Mendelian disorder COPD-related genes SERPINA1, ELN and FBLN5 are shown in Figure 2a and Supplemental Figure S3; c. IPF-related genes (see Supplemental Figure S5 for the full gene list). d Lung cancer-related genes (The Cancer Genome Atlas - TCGA). If mutated, increased copy number or fused with other genes, these genes can become cancer driver genes. For a-d The identities of the cell populations are shown on the y-axis, and the gene symbol and detailed categories of the genes are shown on the x-axis. The size of the dots represents the fraction of the expressing cells in each cell population. The color represents the average gene expression in positive cells

