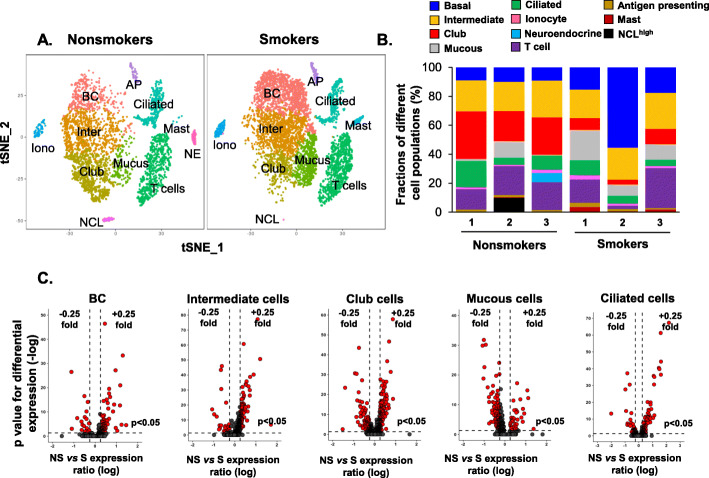
Fig. 3.
Impact of cigarette smoking on gene expression in specific cell populations in the human small airway epithelium. a Unsupervised t-SNE clustering identifies unique corresponding cell populations in nonsmokers (left) vs smokers (right). The names or abbreviations of different cell populations were labeled in the figure. Full names of the abbreviations as followed: BC – basal cells; Inter – intermediate cells; Iono – ionocytes; NE – neuroendocrine cells; AP – antigen-presenting cells; NCL – NCLhigh cells. No neuroendocrine cells were identified in smokers. b Fractions of different cell populations in nonsmokers vs smokers in each individual, nonsmoker (n = 3) vs smoker (n = 3). c Volcano plots of significantly down-regulated (left) and up-regulated (right) genes in smokers (S) vs nonsmokers (NS) in SAE individual cell types, including basal cells, intermediate cells, club cells, mucous cells and ciliated cells. Y-axis represents the negative p value (log) and the x-axis represents the fold-change (log). The cutoff is shown as dotted lines. Fold-change (log) > 0.25 for the up-regulated genes or < − 0.25 for the down-regulated genes, p < 0.05 with Bonferroni correction

