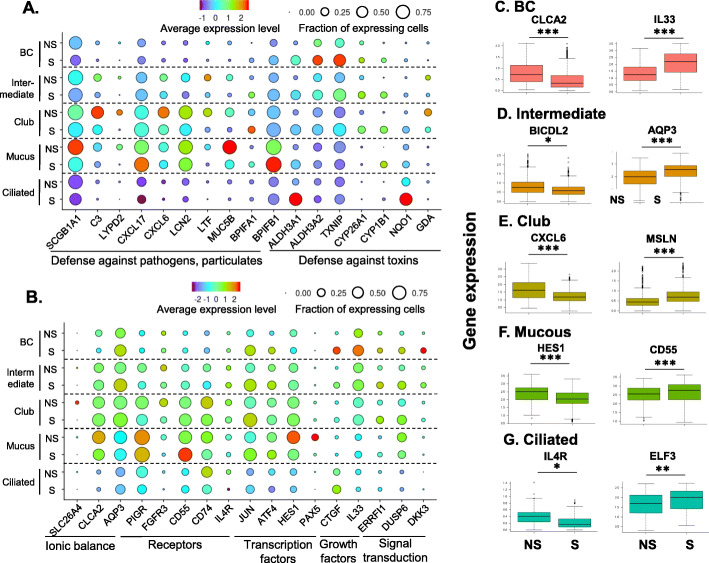
Fig. 4.
Impact of cigarette smoking on gene expression of specific cell populations in the human small airway epithelium. a, b Dot plots of functional categories of cigarette smoking-associated dysregulated genes. The identities of the cell populations are shown on the y-axis, and the functional categories are shown on the x-axis. NS – nonsmokers; S – smokers. The size of the dots represents the fraction of the expressing cells in each cell population, and the color intensity represents the average expression level. c-j Box plots of the cell type-specific down-regulated (left) or up-regulated genes (right) genes in smokers. The data are derived from the single-cell RNA-sequencing dataset. The cell types are labeled on the top of each panel. The box plots were constructed using imputed data. c basal cells, left – CLCA2, right – IL33; d Intermediate cells, left – BICDL2, right – AQP3; e Club cells, left – CXCL6, right – MSLN; f Mucous cells, left – HES1, right – CD55; and g Ciliated cells, left – IL4R, right – ELF3. * p < 0.05, ** p < 0.01 and *** p < 0.001 with Bonferroni correction

