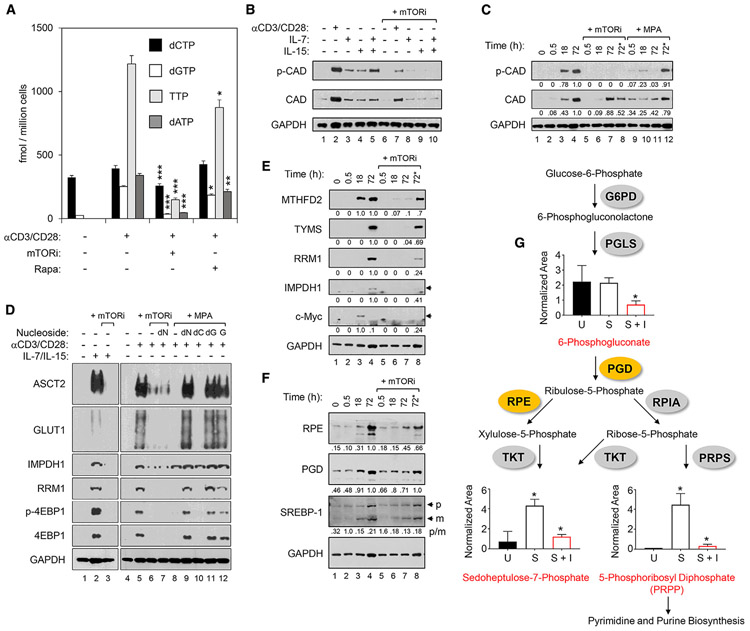
Figure 2. mTOR Activity Is Essential for Deoxyribonucleotide Triphosphates (dNTPs) Pool Expansion via Coordination of Programs for Nutrient Uptake, Pentose Phosphate Pathway (PPP), and Other Nucleotide Biosynthesis Pathways.
(A) Levels of dNTPs in CD4 T cells treated as indicated were determined by LC-MS/MS. Experiments were repeated 3 times using cells from independent donors. Means and SDs of triplicate samples from a single representative donor are shown. Statistical significance was determined by 2-tailed Student’sttests. *p < 0.05, **p < 0.01, and ***p < 0.005.
(B and C). Immunoblots are shown of phosphorylated CAD (p-CAD) and total CAD protein (CAD) in WCLs of CD4 T cells pretreated with mTORi or MPA as in Figure 1, followed by stimulation with α-CD3/CD28 beads for 3 days or γc-cytokines (IL-7 or IL-15) for 5 days (B), or a time course following stimulation with α-CD3/CD28 beads (C). GAPDH is a loading control in both panels. In the lanes labeled 72* in (C), mTORi or MPA (as indicated) were added only at 18 h after stimulation with α-CD3/CD28 beads and analyses done at 72 h after stimulation. (C) includes the relative densitometry values of CAD and p-CAD.
(D) Immunoblots of CD4 T cell WCLs for indicated targets following α-CD3/CD28 or γc-cytokine stimulation of cells following pretreatment with mTORi or MPA, as in (B). The rightmost 5 lanes show decreases in mTOR-dependent phosphorylation of 4E-BP1 (4E-BP1/p-4E-BP1) and expression of ASCT2, Glut1, and RRM1 with MPA pretreatment that were rescued by the positive feedback of guanine nucleotides. Exogenous nucleosides (deoxyribonucleosides [dNs], deoxycytidine [dC], deoxyguanosine [dG], or guanosine [G]) were added at the time of α-CD3/CD28 stimulation, as indicated. GAPDH was a loading control.
(E and F) Immunoblot analyses of the indicated proteins in WCLs of CD4 T cells pretreated with mTORi, as above, followed by stimulation for the indicated time with α-CD3/CD28 beads. In the lanes labeled 72* in (E) and (F), mTORi was added only at 18 h after stimulation with α-CD3/CD28 beads and analyses done at 72 h after stimulation. Below each blot, relative densitometry values are indicated for each target, but for SREBP-1 in (F), the p:m densitometry ratios are presented. Data are representative of 3 independent donors.
(G) Schematic of the PPP and metabolic profiling of pathway intermediates in resting CD4 T cell (U), stimulated for 48 h with α-CD3/CD28 beads in the absence (S) or presence of mTORi pretreatment (S + I). Means and SDs are shown. Data are from 3 independent donors.

