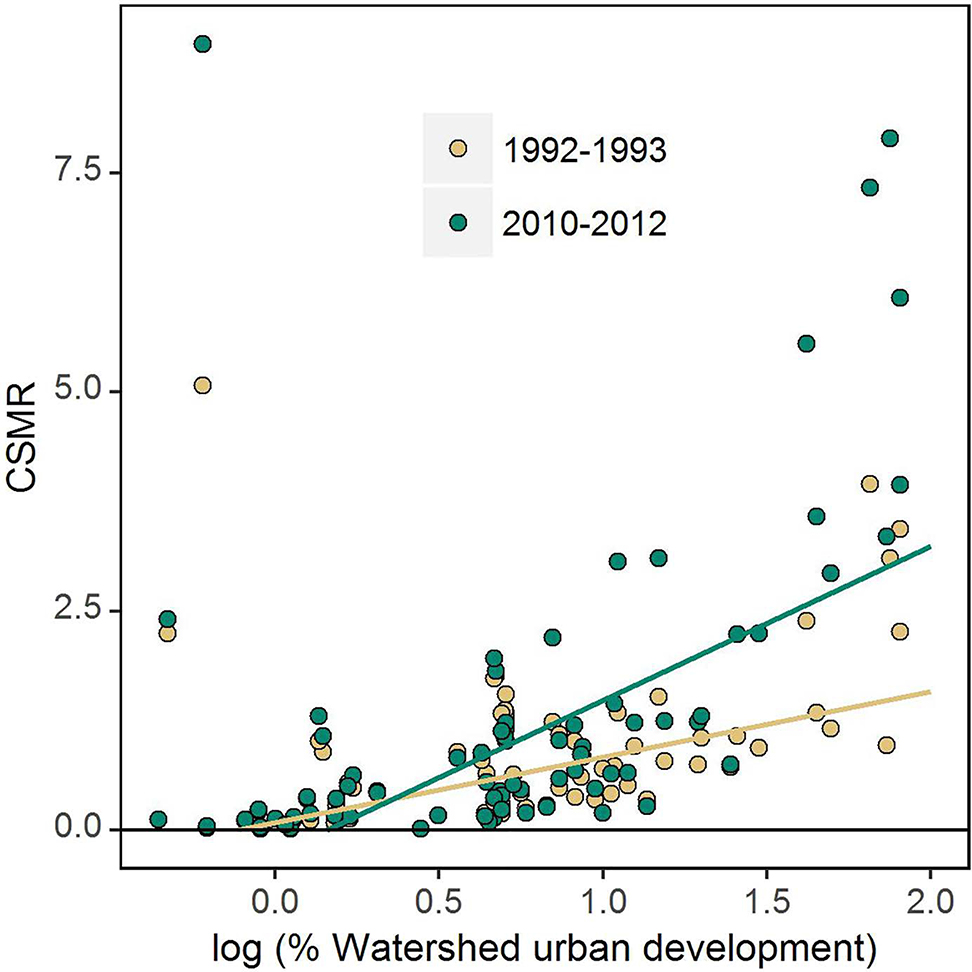
Fig. 2.
Relationship between chloride-sulfate mass ratio (CSMR) and percent urban development in the watershed. The x-axis is expressed on a logarithmic scale. Flow-normalized CSMR is displayed for 1992–1993 (yellow dots) and 2010–2012 (green dots). The lines were drawn using robust regression and are meant to display the general relationship between the variables. (For interpretation of the references to color in this figure legend, the reader is referred to the web version of this article.)

