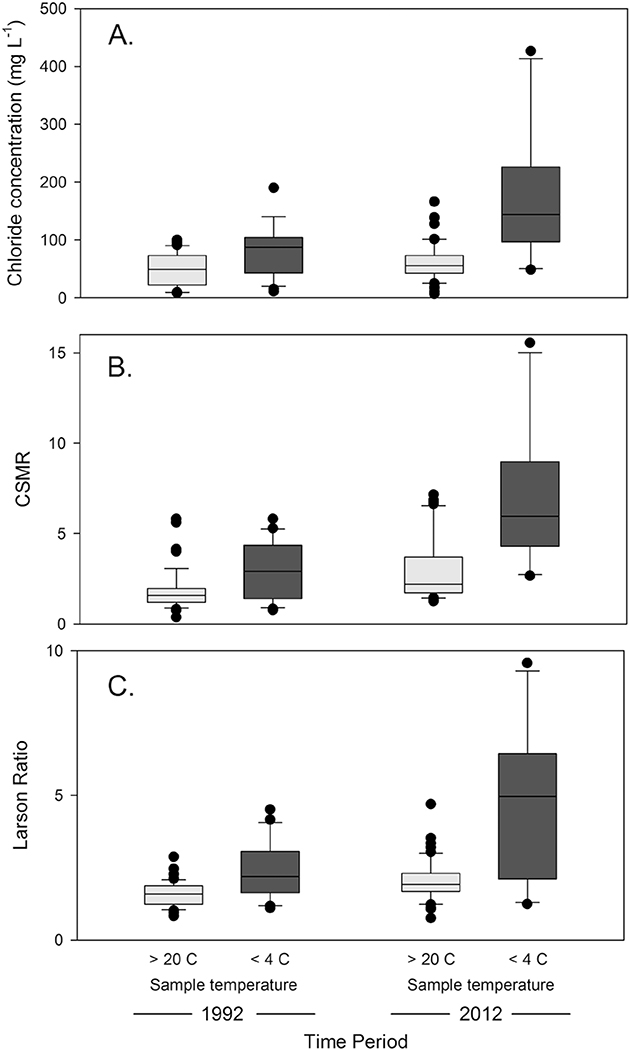
Fig. 3.
Boxplots of raw observations of (A.) chloride concentration (mg L− 1), (B.) chloride-sulfate mass ratio (CSMR), and (C.) Larson Ratio (LR) for samples collected at monitoring stations dominated by urban land cover. Samples were categorized as being collected in cold periods (< 4C) and warm periods (> 20C) during 1991–1993 and 2011–2013 (listed as 1992 and 2012 on the figure, respectively).

