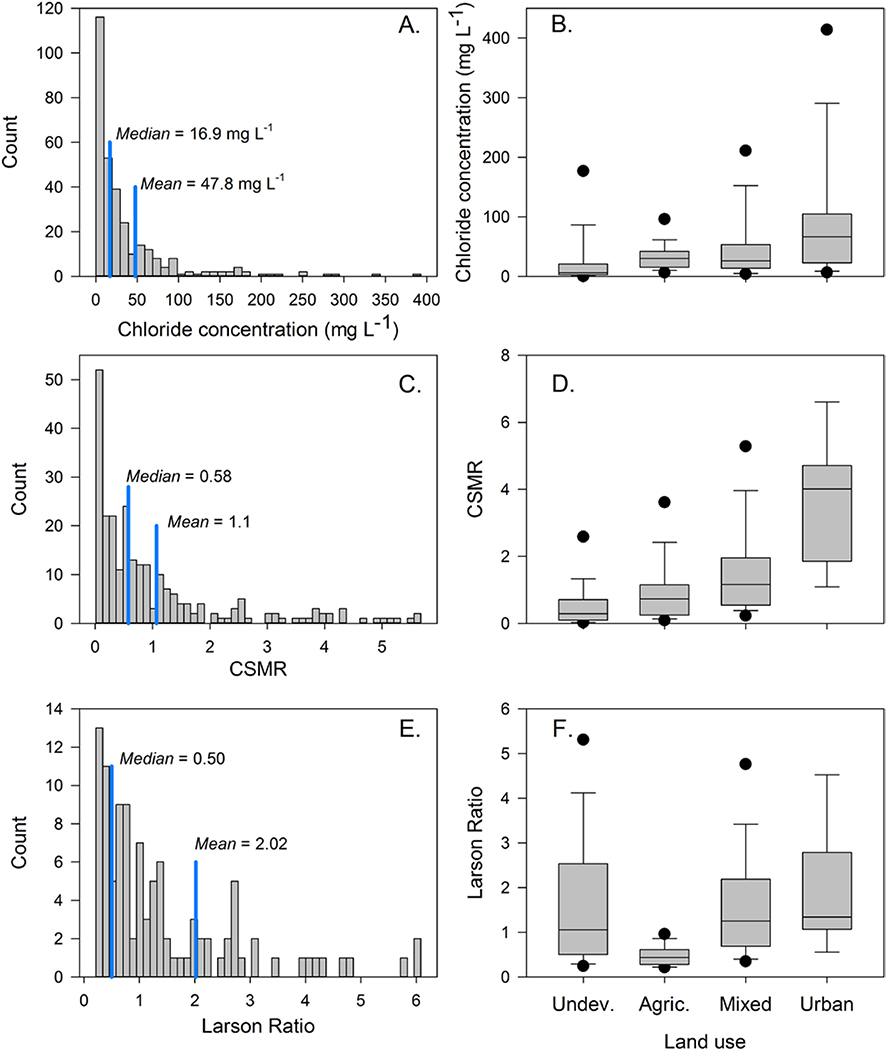
Fig. 4.
Histograms (A., C., and E.) and boxplots (B., D., and F.) of the median chloride concentration (mg L− 1), chloride-sulfate mass ratio (CSMR) and Larson Ratio for all sites included in the status assessment. Histograms express results for all sites while the boxplots express results for each parameter categorized by land use. The land use categories include undeveloped (Undev.), agricultural (Agric.), mixed, and urban.

