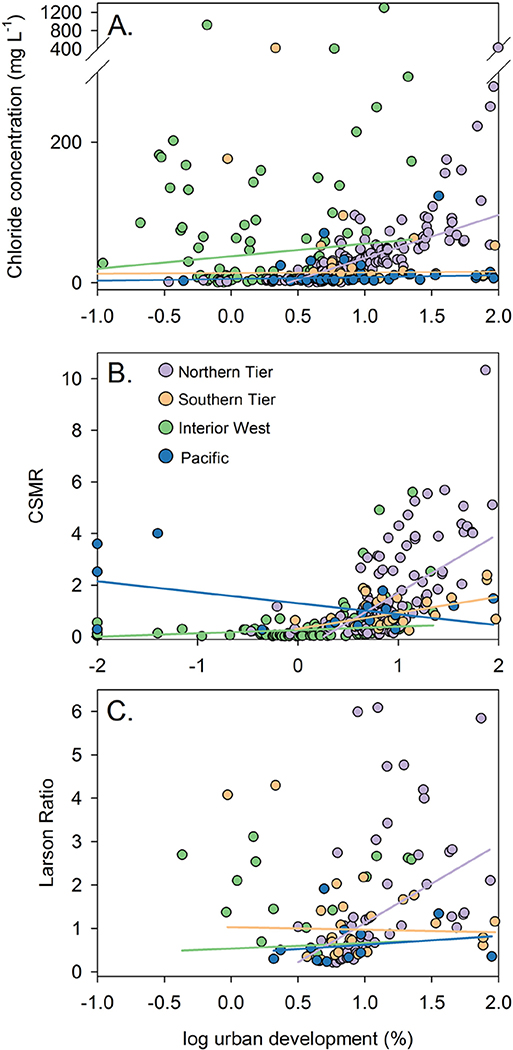
Fig. 5.
Relationships between watershed percent urban development expressed on a log scale and median (A.) chloride concentration (mg L− 1), (B.) chloride-sulfate mass ratio (CSMR), and (C.) Larson Ratio for sites included in the status assessment. Points represent results for individual sites colored by region. Lines express the robust regression fit between urbanization and each parameter color-coded by region.

