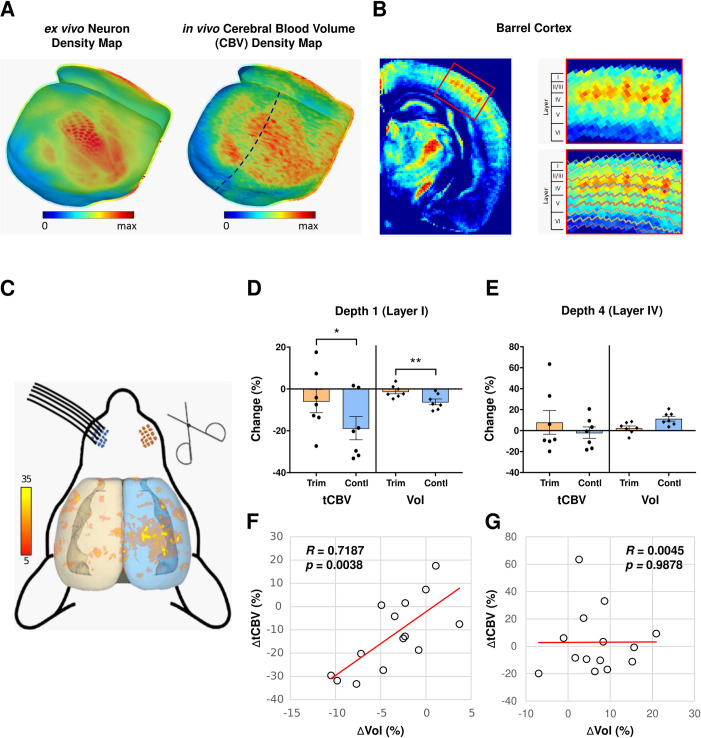
Fig 1. Mapping dendritic spine loss with CBV-fMRI and volumetric MRI.
(A) 3D mouse cortical surface maps of the ex vivo neuron density (left image) and in vivo cerebral blood volume (CBV) density (right image). Cortical surface maps were generated from the template images using our proposed MouseStream software suite by projecting the mean density along each streamline (see Method for details). (B) CBV density map in a single coronal slice of the right hemisphere (dashed line in panel A right image) going through the barrel cortex (left image) and the zoom-in view of the barrel cortex (right image). The CBV density map was generated as the population average of 14 co-registered CBV scans. The whole cortex was delineated evenly into 8 depths by solving the Laplace’s Equation. Cortical layers were defined using the Allen Brain Atlas anatomical CCF v3 template. Individual barrel modules with high basal metabolism were observed at layer-IV of the barrel cortex. (C) Result of voxel-based analysis of percent CBV density (%CBV) across the whole cortex. The t-value distribution of CBV decrease during 30-day trimming period across cortical regions shows that the barrel cortex on the control side (right hemisphere) has significant CBV decreases (p<0.05, cluster>20) and the barrel cortex contralateral to the trimmed side (left hemisphere) has no clear CBV decreases. (D) Total CBV (tCBV) and volume changes over 30-day trimming period in the depth 1 (belongs to layer I) of the barrel cortex. At the depth that corresponds to layer I, both tCBV and volume have significant decreases on the control side and whisker trimming significantly reduces both tCBV and volume decreases over 30 days on the trimmed side. (E) Total CBV (tCBV) and volume changes over 30-day trimming period in the depth that corresponds to layer IV of the barrel cortex. Both tCBV and volume have no significant changes on the control side and there is no significant whisker trimming effect on tCBV or volume changes over 30 days on the trimmed side. (F) Changes in total CBV (tCBV) is tightly correlated with changes in volume over the 30-day trimming period at the depth that corresponds to layer I of the barrel cortex (R = 0.7187, p = 0.0038). (G) Changes in total CBV (tCBV) is independent of changes in volume over 30-day trimming period at the depth that corresponds to layer IV of the barrel cortex (R = 0.0045, p = 0.9878).

