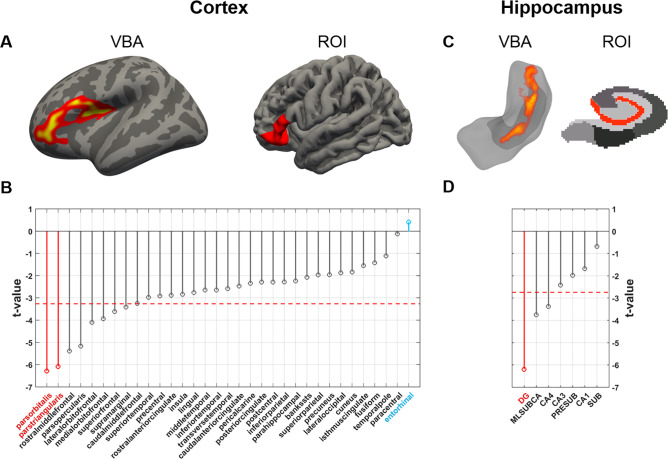
Fig 2. Mapping aging with CBV-fMRI from 20–72 years of age.
(A) A vertex-based analysis of the cortex (VBA; left image) and a region-of-interest analysis across cortical regions (ROI; right image) identified the greatest age-related decrease in cerebral blood volume (CBV) in the inferior frontal gyrus. (B) The t-value distribution of age-related CBV decreases across cortical regions shows that two regions of the inferior frontal gyrus (indicated in red, the pars orbitalis and the pars triangularis) are most reliably vulnerable to aging. The entorhinal cortex (indicated in blue) was found most resistance to aging. The dashed red line indicates the t-value threshold at α = 0.05 adjusted for Šidák multiple comparison. (C) A voxel-based analysis of the hippocampus (VBA; left image) and a region-of-interest analysis across hippocampal regions (ROI; right image) identified the greatest age-related CBV decrease in the dentate gyrus. (D) The t-value distribution of age-related CBV decrease across hippocampal regions, shows that the dentate gyrus (indicated in red) is most reliably vulnerable to aging. The dashed red line indicates the t-value threshold at α = 0.05 adjusted for Šidák multiple comparison.

