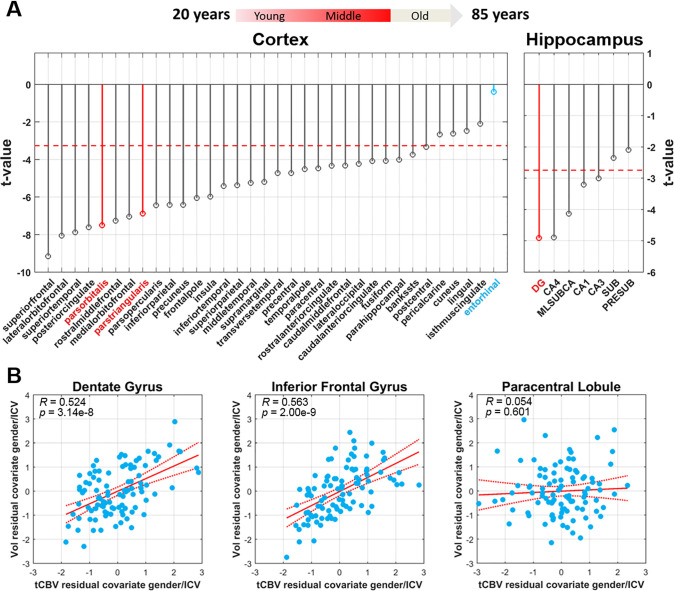
Fig 3. Mapping aging with volumetric MRI from 20–72 years of age and its relationship to CBV-fMRI.
(A) The t-value distribution of age-related decrease in volume, measured by structural MRI, across cortical regions in 20-72-year old healthy subjects (indicated in red is the arrow illustration above) While not most reliably affected, volume in regions of the inferior frontal gyrus (indicated in red) show a decrease with age. The volume of the entorhinal cortex (indicated in blue) was found most resistance to aging. The dashed red line indicates the t-value threshold at α = 0.05 adjusted for Šidák multiple comparison. (B) A significant relationship between CBV and volume observed for the dentate gyrus and the inferior frontal gyrus, a joint MRI biomarker which best correlates with dendritic spine loss, but not for the entorhinal cortex.

