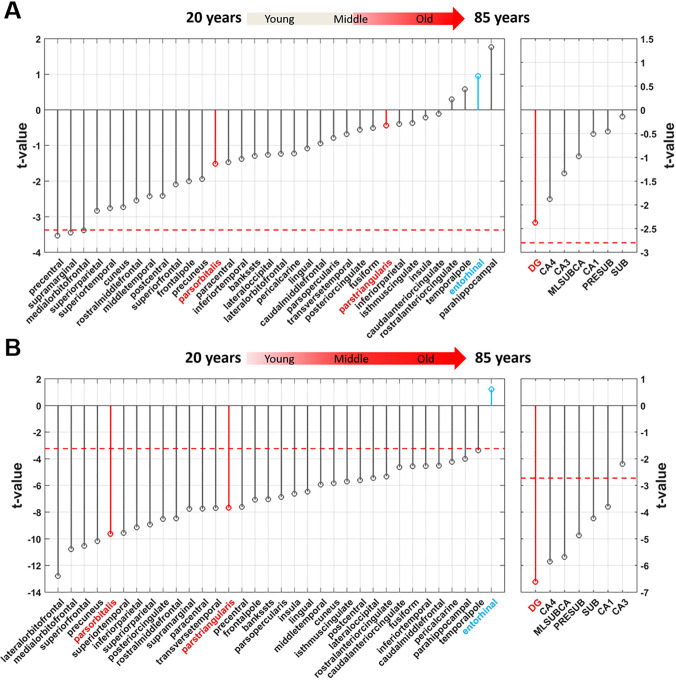
Fig 4. Mapping aging with volumetric MRI from 62–85 years of age and across the age-span.
(A) The t-value distribution of age-related decreases in volume across cortical and hippocampal region in Alzheimer’s-free 62–85 year old subjects (indicated in red in the arrow illustration above), shows that the dentate gyrus is most vulnerable to aging (although not crossing threshold of multiple comparisons) and the inferior frontal gyrus (indicated in red, left graph) is not reliably associated with aging. The entorhinal cortex (indicated in blue, left graph) is the region least affected by aging. The dashed red line indicates the t-value threshold at α = 0.05 adjusted for Šidák multiple comparison. (B) The t-value distribution of age-related decrease in volume across cortical and hippocampal region in Alzheimer’s-free subjects across the full age-span, of both the ADNI and Columbia aging cohort, (indicated in red in the arrow illustration above), shows that the dentate gyrus (indicated in red, right graph) is most vulnerable to aging and the inferior frontal gyrus (indicated in red, left graph) is reliably associated with aging. The entorhinal cortex (indicated in blue, left graph) is the region least affected by aging. The dashed red line indicates the t-value threshold at α = 0.05 adjusted for Šidák multiple comparison.

