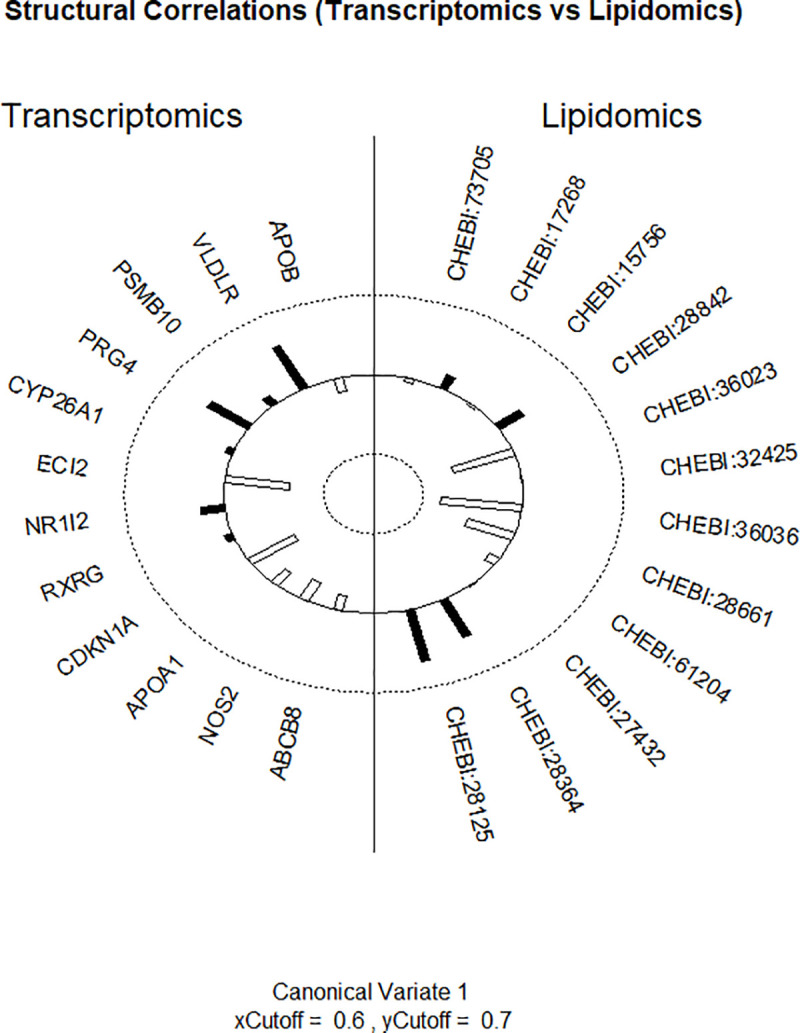
Fig 2. The canonical correlation results for one subset of transcriptomic and lipidomic data.

Positive correlation represented by bars directed to the outside of the circle, and a negative correlation towards the inside. The height of the bars indicates the strength of the association.
