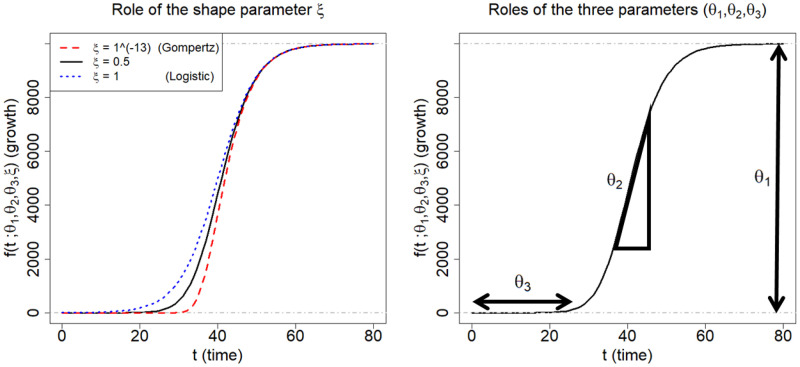
Fig 3. Description of the Richards growth curve model.
The curve is obtained when (θ1, θ2, θ3) = (10000, 0.2, 40). The left panel is obtained by changing the ξ to be 1 × 10⁻¹³, 0.5, and 1, respectively. The right panel describes the roles the three parameters in epidemiological modeling: θ1 represents final epidemic size; θ2 is an infection rate; and θ3 is a lag phase.

