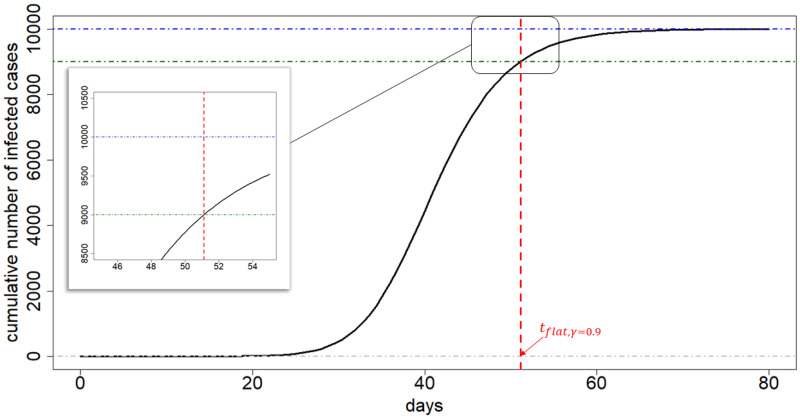
Fig 7. Illustration of flat time point.
The exemplary infection trajectory is obtained by the Richards curve when (θ1, θ2, θ3, ξ) = (10000, 0.2, 40, 0.5). A flat time point tflat,γ is approximately 51 (vertical red dashed line). The vertical difference between the θ1 and the function value of Richards curve evaluated at tflat,γ is γ = 0.9.

