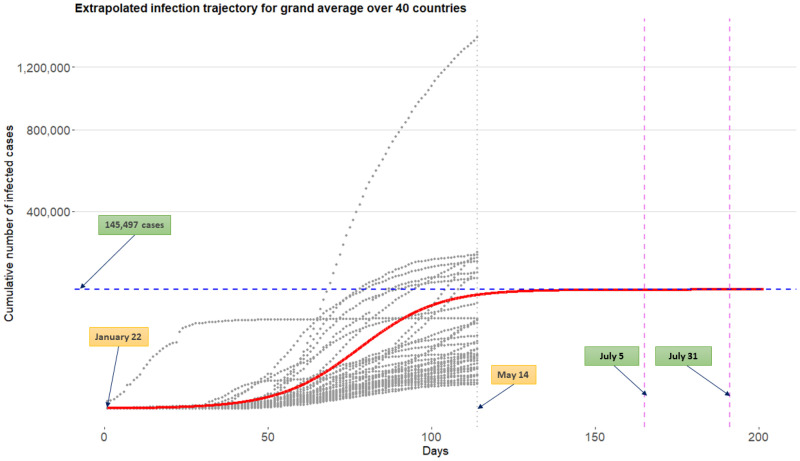
Fig 9. Extrapolated infection trajectory for grand average over 40 countries obtained from the model .
Grey dots are historical infection trajectories for 40 countries spanning from January 22nd to May 14th. Posterior means for the flat time points are tflat,γ=0.999 = July 5th and tflat,γ=0.9999 = July 31st.

