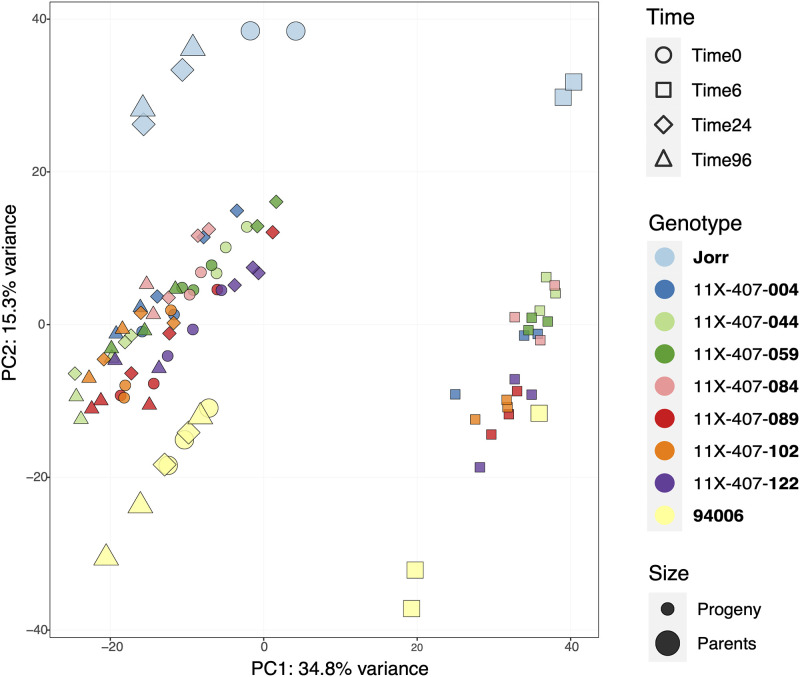
Fig 2. PCA plot of all samples of the two parent species and seven progeny genotypes at four time points.
Parental species and progeny genotypes were depicted using different colors. Different time points were represented as different shapes (Circle: Time 0; Square: Time 6h; Diamond: Time 24h; Triangle: Time 96h). The two parents were marked prominently with larger dots to make it easier to distinguish parents from the parents from the F1 hybrids. The horizontal PC1 dimension, which accounts for 34.8% of the variance among all samples, separated samples among the Time 6h and other time points. The vertical PC2 dimension, which accounts for 15.3% variance of all samples, grouped the parental species separately and the seven progeny genotypes clustered together intermediate to both the parents.

