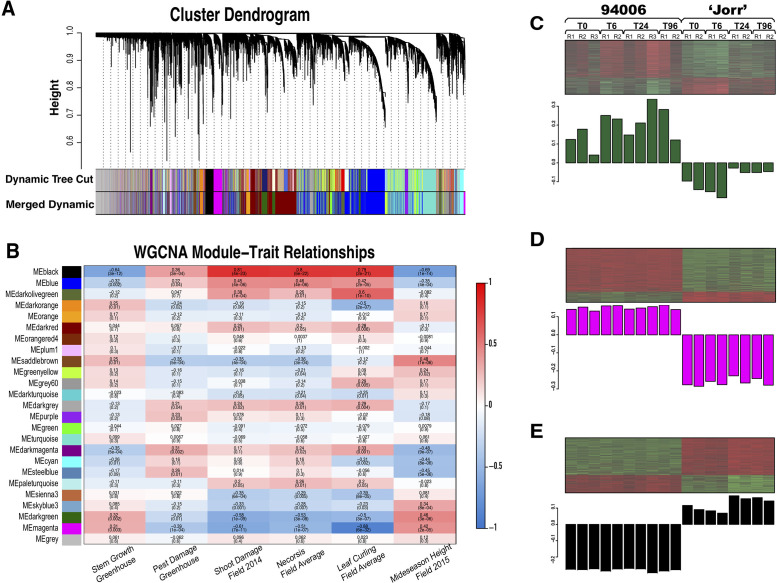
Fig 4. Co-expression analyses of all genes across all samples.
A) Hierarchical cluster tree showing 25 modules of co-expressed genes. Each gene is represented by a leaf in the tree. The WGCNA cluster dendrogram on all 96 samples grouped the genes into 25 distinct modules (Row—Merged Dynamic); B) WGCNA Module-trait relationships table. On the left side, each row represents a co-expressed gene cluster, and each column represents data for a phenotype: from left to right–greenhouse stem growth rate; greenhouse pest damage; field shoot damage; field necrosis; field leaf curling; field plant heights. The field damage data (shoot damage, leaf necrosis and leaf curl) were averaged for three different time points for this table. Light color cells within this row indicate low correlation with phenotypes. The right panel shows the heatmaps of gene expression and the eigengene expression profiles across each library of parent genotypes S. purpurea 94006 and S. viminalis ‘Jorr’ for C) Module darkgreen, D) Module magenta and E) Module black. The eigengene represents the standardized relative expression levels for each library. Genotype, sampling time point (hat) and biological replicate numbers are indicated above each column in the eigengenes profiles. Columns are vertically aligned for all three modules.

