
Figure 1: Mean Difference between Children with and without Obesity.
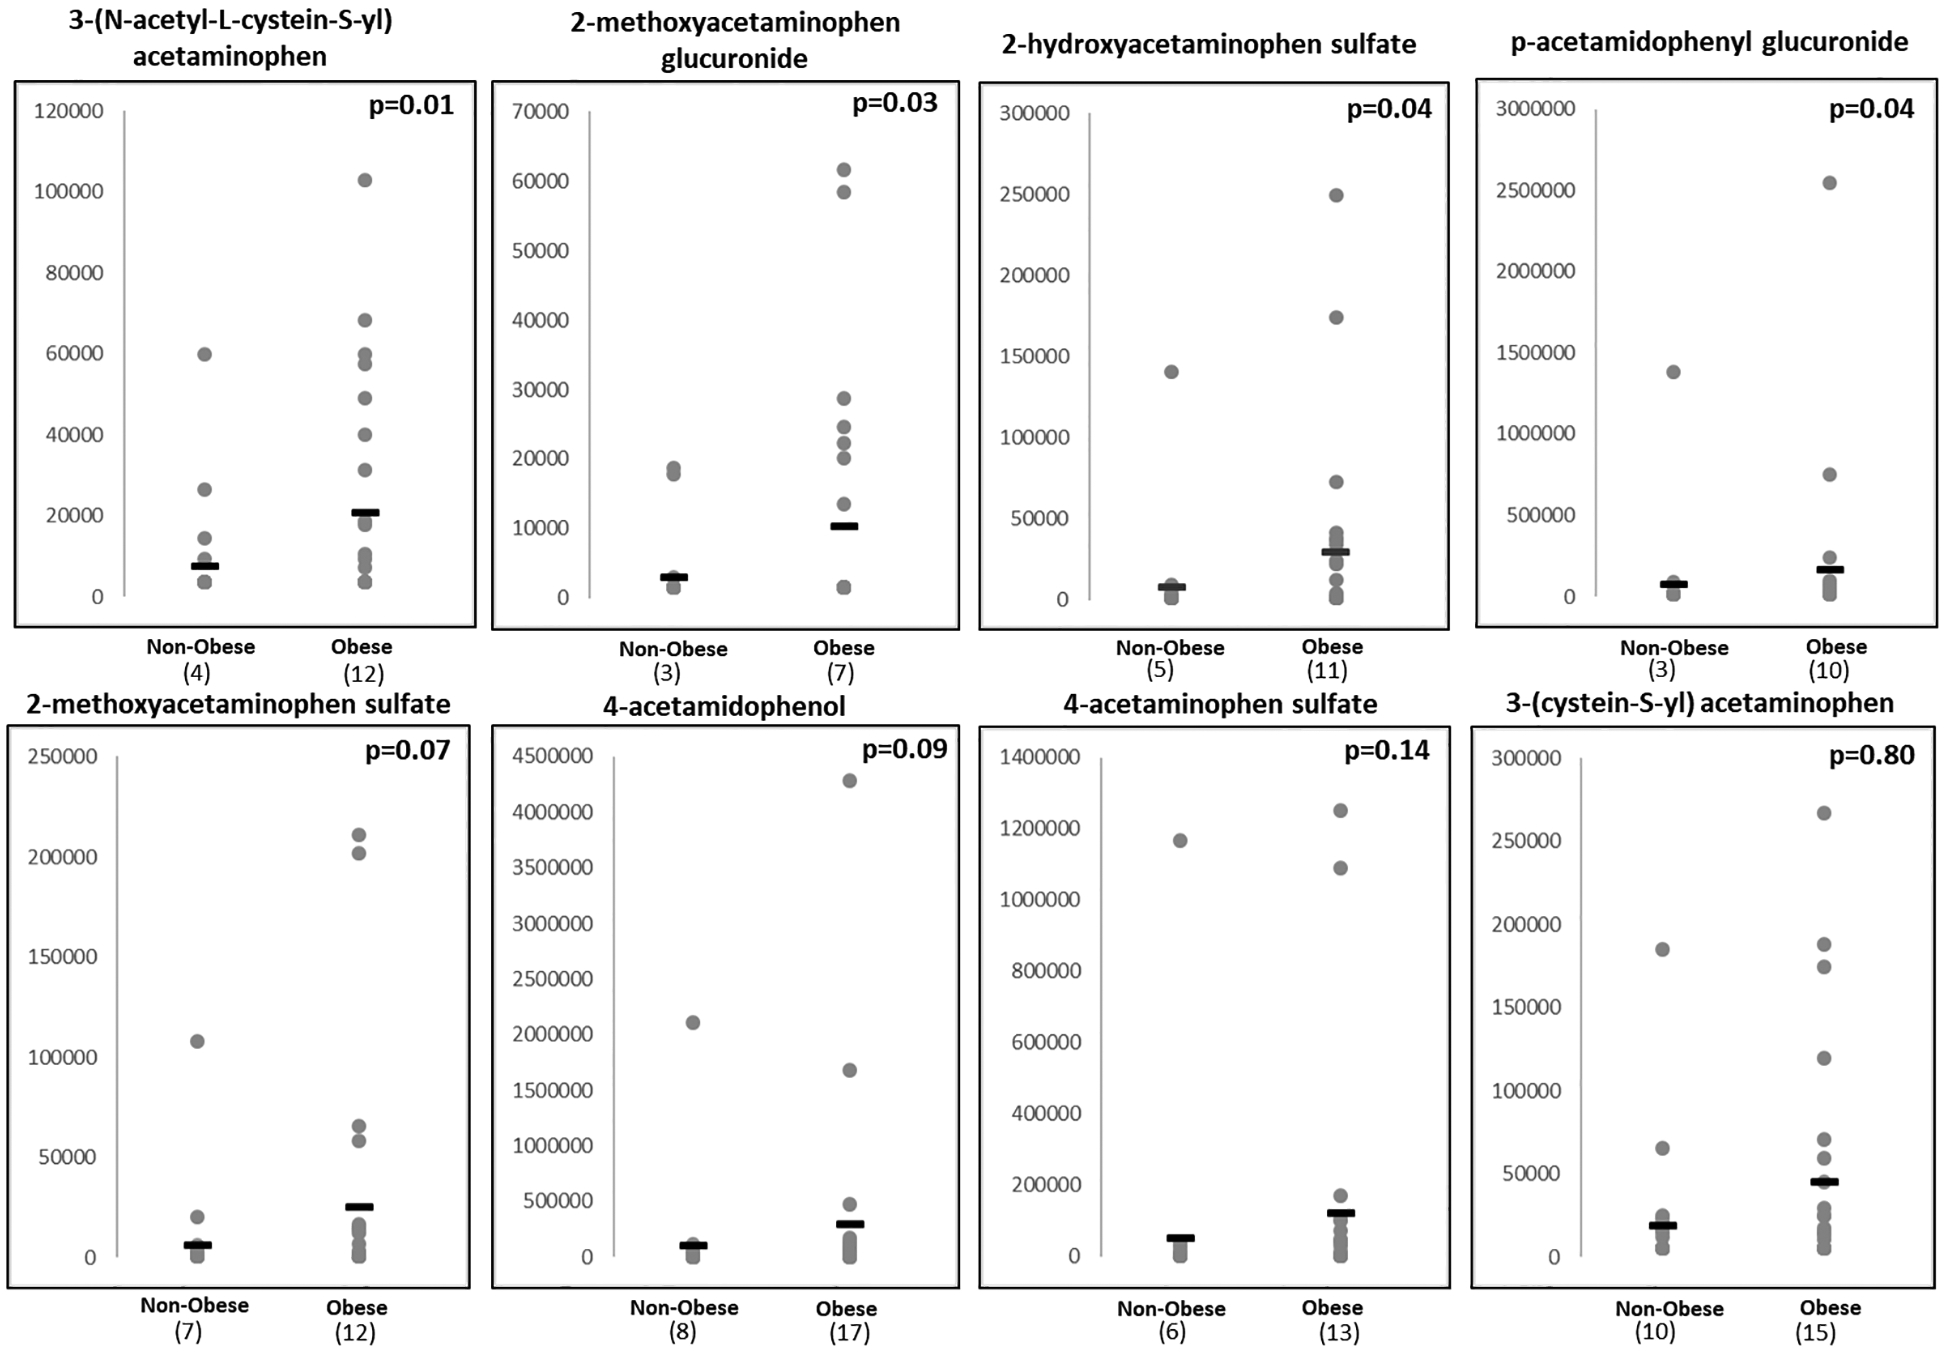
Shown are 8 metabolites of acetaminophen measured through agnostic metabolomics array (Metabolon Inc.) P-values calculated using logistic regression corrected for maternal pre-pregnancy BMI.
Y-axis = arbitrary units derived from Area Under the Curve (AUC) values. Non-detect values were imputed as ½ the lowest detectable level for each metabolite and number of children with detectable levels is reflected below each plot.