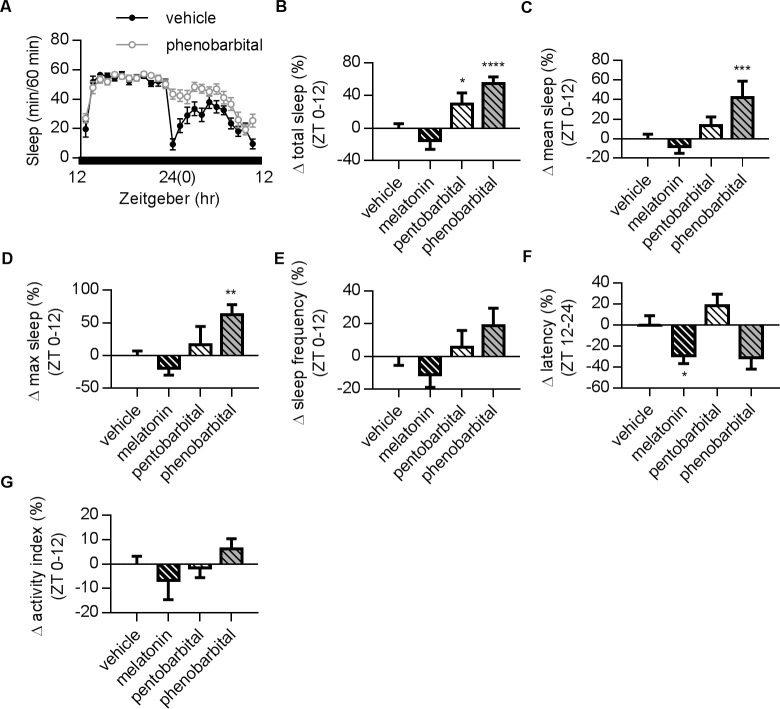
Fig 4. Effects of different sleep-aiding compounds in DD condition.
(A) Representative plots showing the sleep profiles of vehicle and phenobarbital in DD conditions. (B) Effects of melatonin, pentobarbital and phenobarbital on total sleep time at ZT 0–12. Drugs were presented in food three days before and during the recordings. The results for ZT 12–24 are shown in S2 Fig. Phenobarbital and pentobarbital significantly increased total sleep. (C) Summary of changes on mean sleep time. Phenobarbital significantly increased mean sleep. (D) Summary of changes on maximum sleep duration. Phenobarbital significantly prolonged maximum sleep. (E) Three drugs had no significant effect on sleep frequency. (F) Melatonin significantly reduced latency. (G) Activity index remained unchanged in all drug-treatment groups. Values for individual groups illustrate the changes in percentage from vehicle group after normalization for comparisons in (B-G). Error bars indicate SEM. N numbers for vehicle, melatonin, pentobarbital, and phenobarbital: 40, 15, 16, and 12. One-way ANOVA followed by a Fisher’s LSD test (compared with the vehicle feeding group) was used for statistical analysis. *, p < 0.05; **, p < 0.01; ***, p < 0.001; ****, p < 0.0001.

