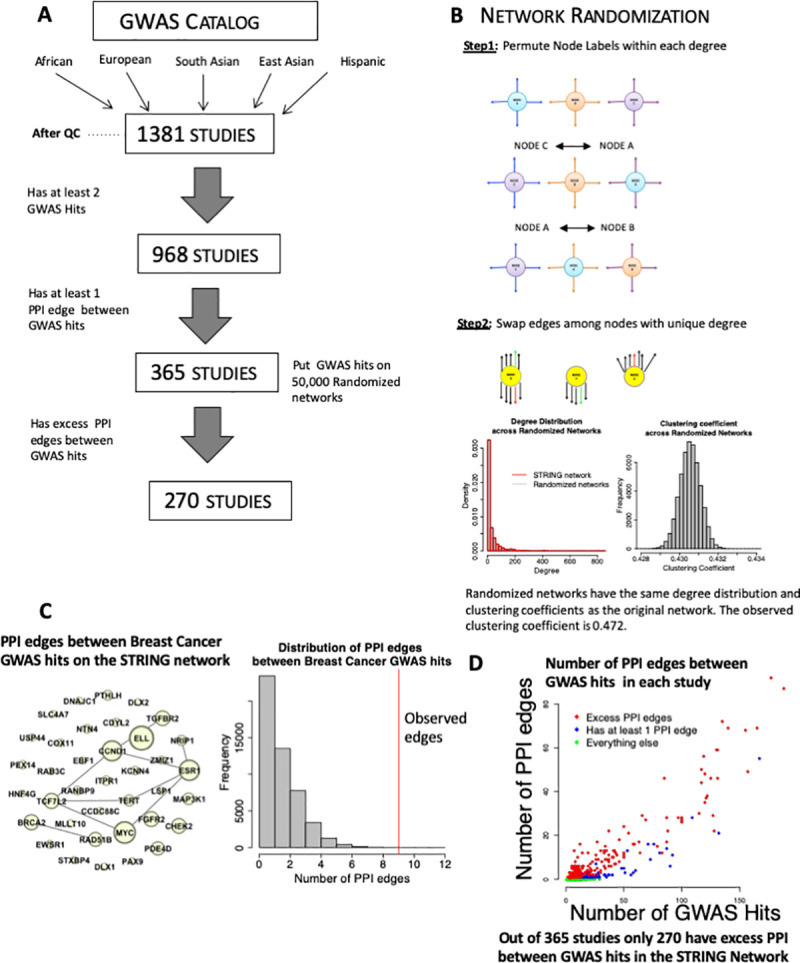
Fig 1. Identifying studies with excess PPI amongst GWAS hits.

(A) A subset of GWAS studies had excess protein-protein interactions amongst their GWAS hits. 1,381 GWAS studies were obtained from the GWAS catalog, of these 968 had at least 2 GWAS hits and 365 studies had at least 1 PPI edge between GWAS hits. Out of these 365 studies, 270 studies had more PPI edges between their GWAS hits than expected by chance. (B) (top) Schematic of our procedure for randomizing networks. We implemented the method from [27]. To maintain topology, randomized networks were created by swapping labels among nodes with the same degree and swapping edges among nodes with unique degree. (bottom) Degree distribution and distribution of clustering coefficients across 50,000 randomized networks. (C) (left) Illustrative GWAS study (Breast Cancer risk, (GCST001937)) with 37 GWAS hits, and 9 PPI edges between GWAS hits. The size of each node denotes its degree, and edges between nodes indication PP interactions. (right) Results of permutation testing reveals that the observed 9 PPI edges between the 37 GWAS hits is in excess of the expected number of PPI edges obtained from 50,000 randomized networks. (D) In blue are the 365 GWAS studies with at least 1 PPI amongst their GWAS hits, in red are the 270 studies with more PPI amongst their GWAS hits than expected by chance (FDR < 0.05).
