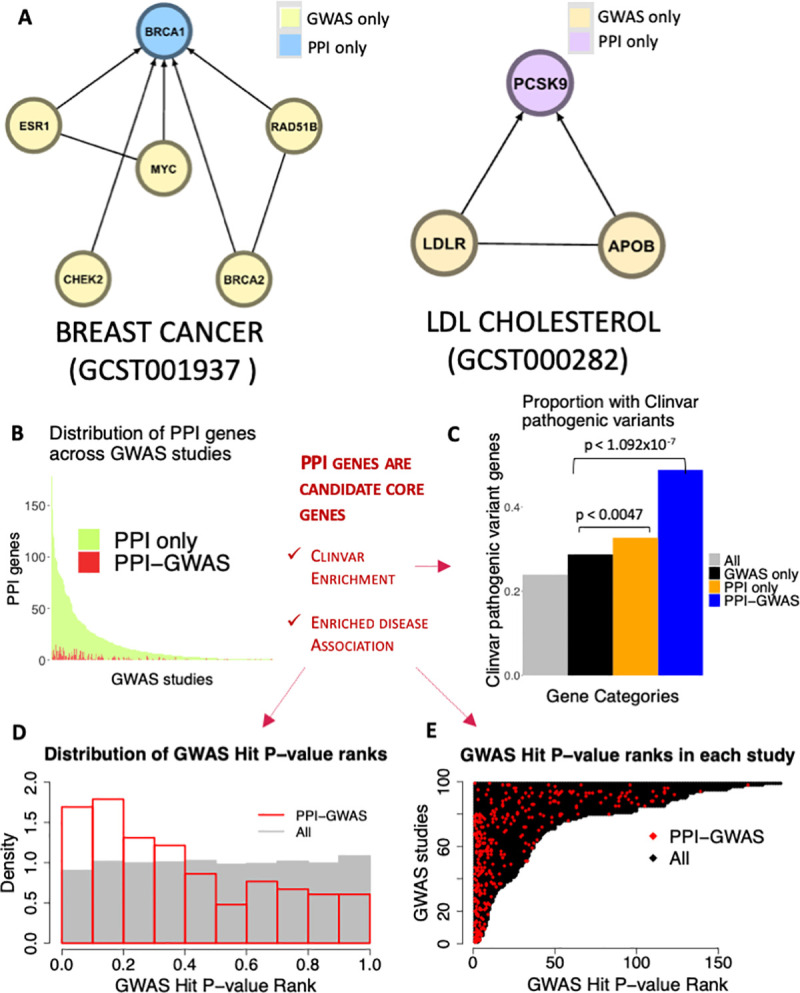
Fig 3. PPI gene examples.

(A) Representative examples of PPI genes predicted by our method. The lines between nodes represent PPI, and the GWAS hits are depicted as pointing to PPI genes. The corresponding GWAS catalog study accessions are shown within parentheses. (B) Proportion of PPI genes within the 343 studies that we detect PPI genes in that are PPI only compared to PPI-GWAS. (C) Proportion of Clinvar pathogenic variant containing genes in All 11,049 nodes, GWAS only, PPI only and PPI-GWAS. We found enrichment in PPI only compared to GWAS only (p < 0.0047, Fisher’s Exact Test) and in PPI-GWAS compared to GWAS only (p < 1.092x10⁻⁷, Fisher’s Exact Test). (D) Out of 343 GWAS studies in which we detected PPI genes, 99 had at least 1 PPI-GWAS. We ranked the GWAS hits within each study by the GWAS p-value, and then computed rank fractions (rank/number of GWAS hits in the study). In gray is the distribution of rank fractions, across all GWAS hits from the 99 studies, in red is the distribution of rank fractions amongst only the PPI-GWAS. The PPI-GWAS distribution is skewed to the left indicating that PPI-GWAS tend to have more significant p-values compared to GWAS only. (E) In black are the ranks of all GWAS hits in the 99 GWAS studies, and in red are the ranks of only the PPI-GWAS. PPI-GWAS tend to cluster towards the left of the plot, indicating that PPI-GWAS tend to have more significant GWAS p-values.
