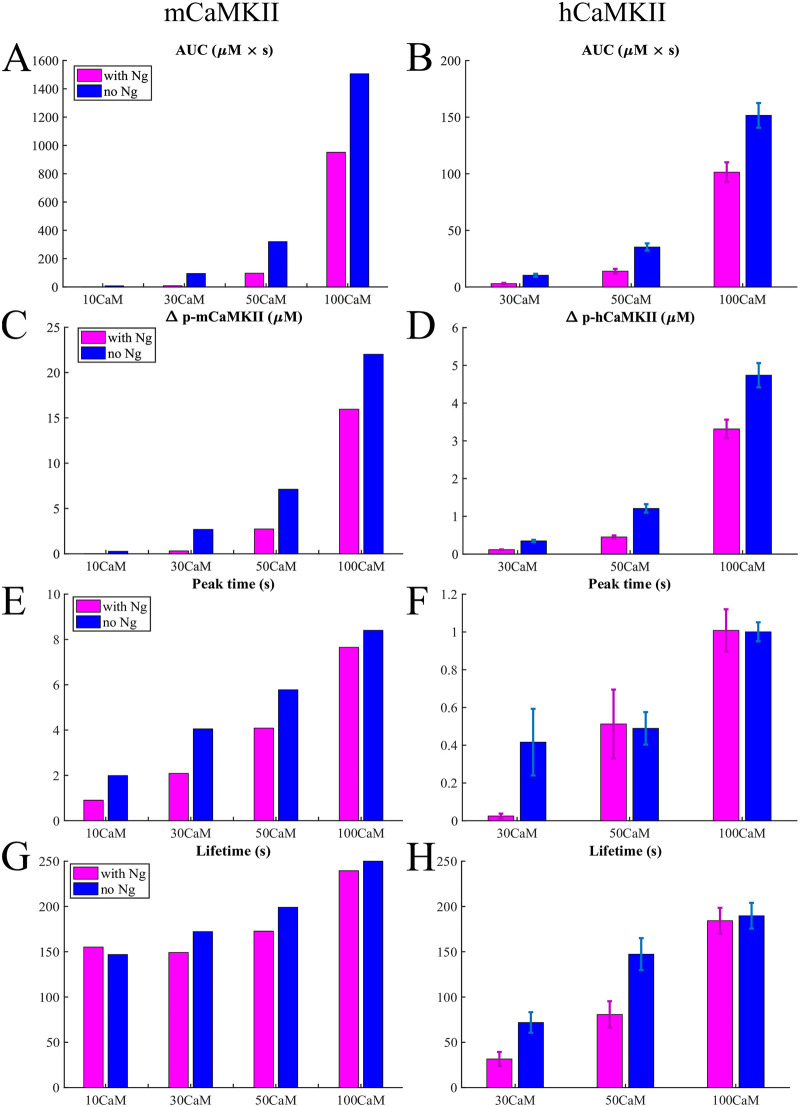
Fig 7. Quantifying the response to a calcium spike.
Bar graphs in different conditions for the monomers and holoenzymes respectively of Area Under the Curve (AUC) (A) and (B), the maximum increase in phosphorylated CaMKII concentration (C) and (D), the time of the phosphorylation level reaching its peak (E) and (F), and the lifetime defined in the main text (G) and (H) in response to a 10 μM Ca2+ pulse.

