Figure 8.

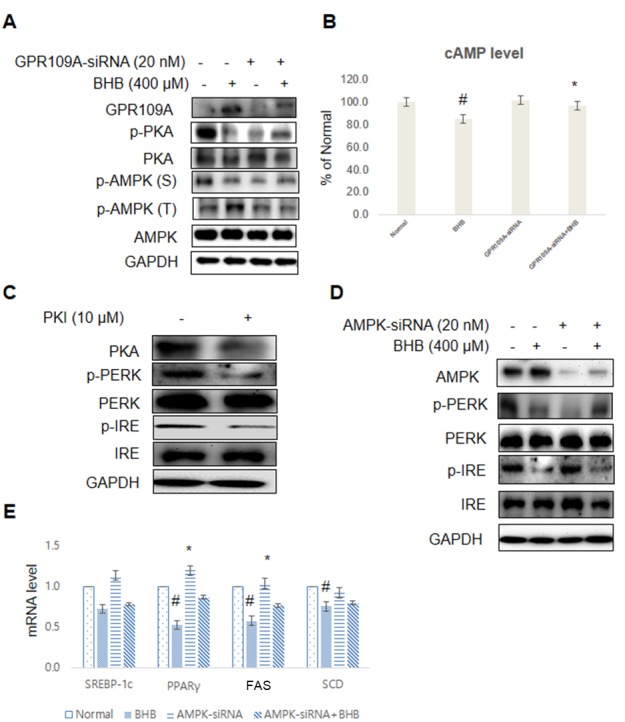
BHB suppressed ER stress and lipid accumulation through GPR109A/PKA/AMPK in the cells. (A) The cells were treated with the BHB (400 µM) for 4 h. The cells pre-incubated with GPR109A-siRNA (20 nM) for 44 h were subjected to western blotting analysis using GAPDH as control. GPR109A, p-PKA, PKA, p-AMPK (Ser), p-AMPK (Thr), and AMPK levels were assessed. (B) The cAMP level measured after stimulation with BHB in the absence (-) or presence (+) of GPR109A-siRNA in the liver. The results of Student’s t-test are shown. #p < 0.05 vs. normal; *p < 0.05 vs. GPR109A-siRNA treated cells. (C) HepG2 cells were transfected and pre-incubated with PKI (10 µM) for 1 h. The cells were analyzed by Western blotting using PKA, p-PERK, PERK, p-IRE, IRE, and GAPDH antibodies. (D) The cells were treated with the BHB (400 µM) for 4 h. The cells pre-incubated with AMPK-siRNA (20 nM) for 44 h were subjected to western blotting analysis using GAPDH as control. AMPK and ER stress markers (p-PERK, PERK, p-IRE, and IRE) were assessed using cytosolic proteins from HepG2 cells. (E) The cells incubated with BHB (400 µM) for 4 h. The cells pre-transfected with AMPK-siRNA (20 nM) for 44 h were subjected to qPCR analysis using actin as a control. The mRNA expression of the lipogenic genes (SREBP-1c, PPAR, FAS, and SCD) was assessed. The results were normalized with respect to the actin level. #p < 0.05 vs. Normal; *p < 0.05 vs. AMPK-siRNA group.
