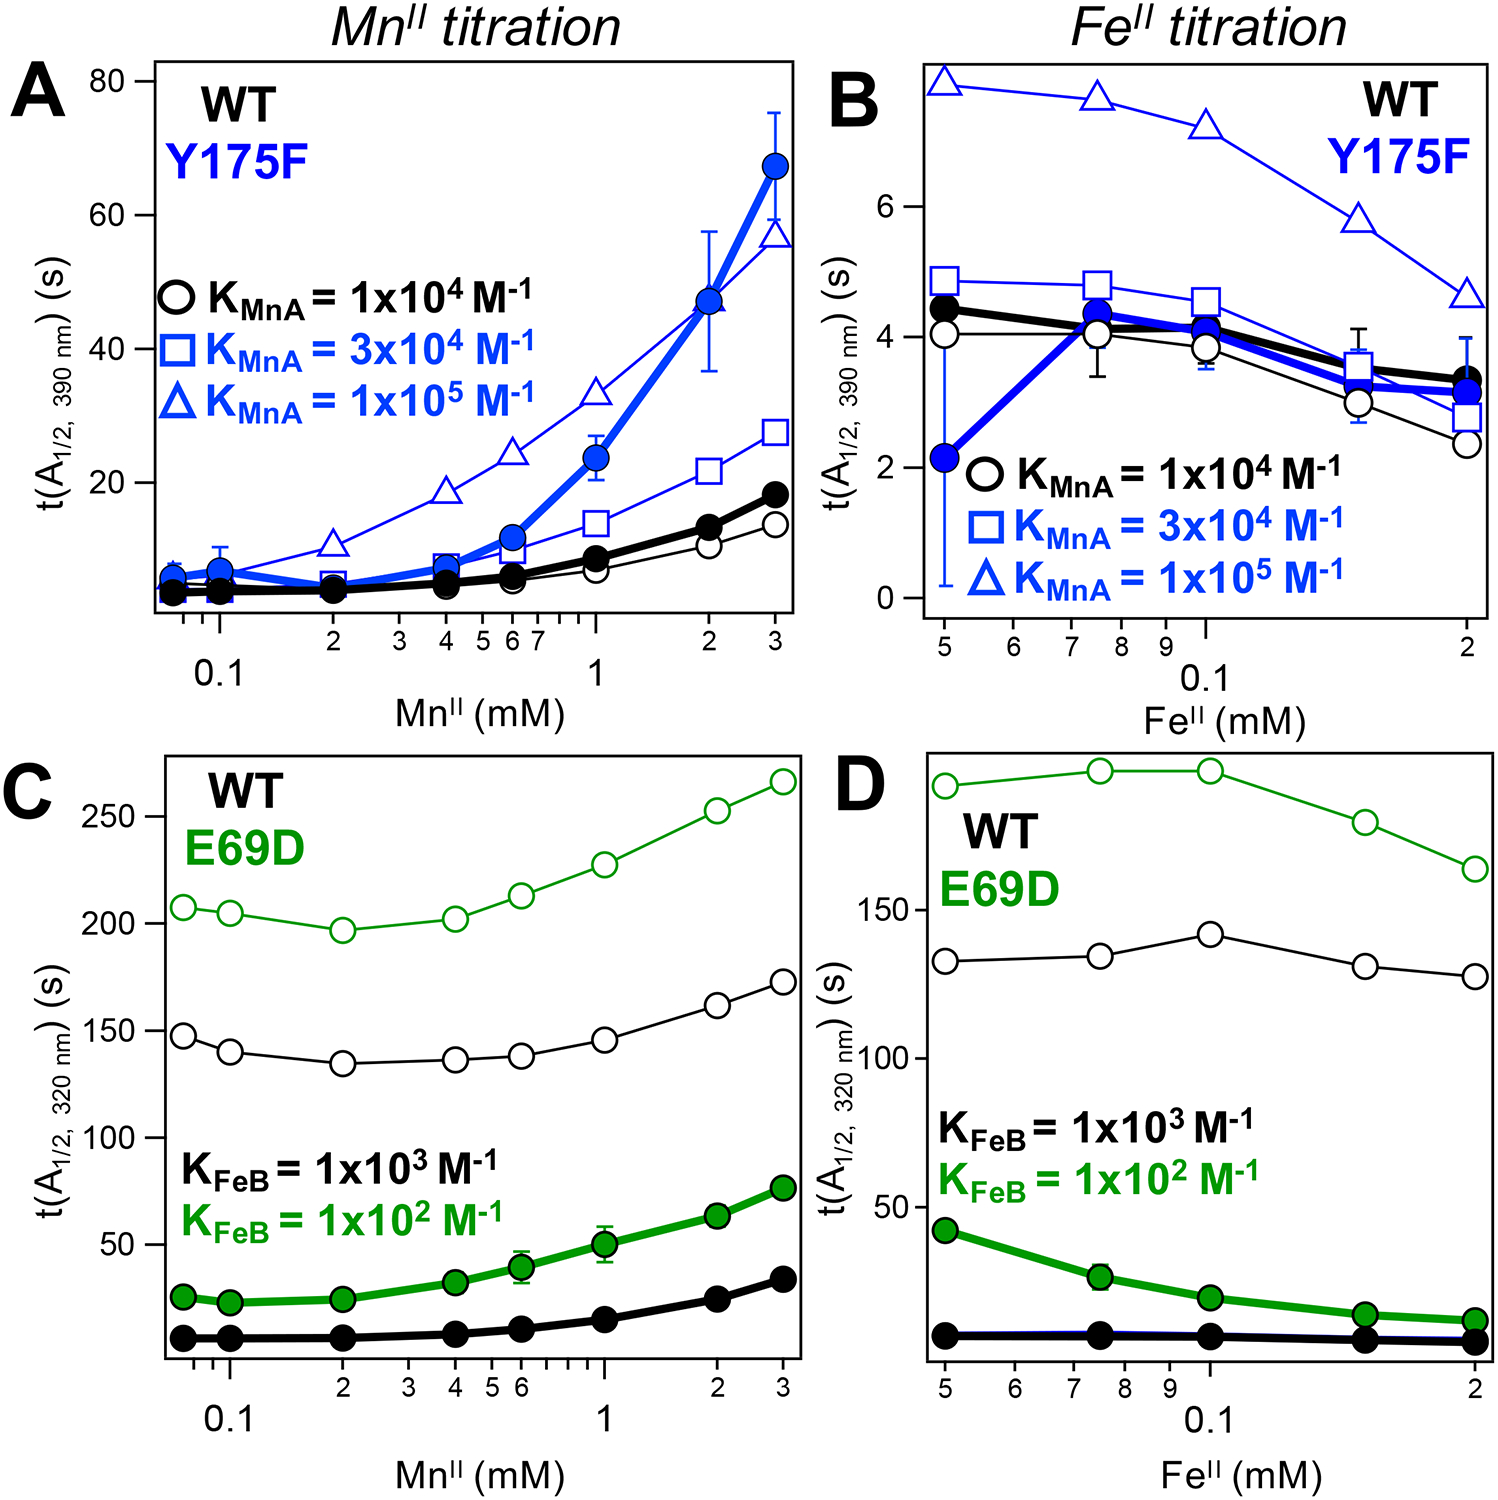
Figure 5.

MnII (A, C) and FeII (B, D) inhibition curves for WT (black), Y175F (blue), and E69D (green). Curves generated from SF data (solid symbols) or kinetic modeling (open symbols) for either the I2 (top) or the resting state (bottom) species. Metal binding affinities used to model mutant data are indicated, with koff = 10 s−1 and kon adjusted accordingly; remaining rates were held the same as in the WT competitive/ordered model. For Y175F, modeled inhibition curves generated for KMnA = 3 × 10⁴ M−1 (squares) and 1 × 10⁵ M−1 (triangles) are shown to bound the experimental data. MnII and FeII concentrations shown in log scale.
