
Figure 8.
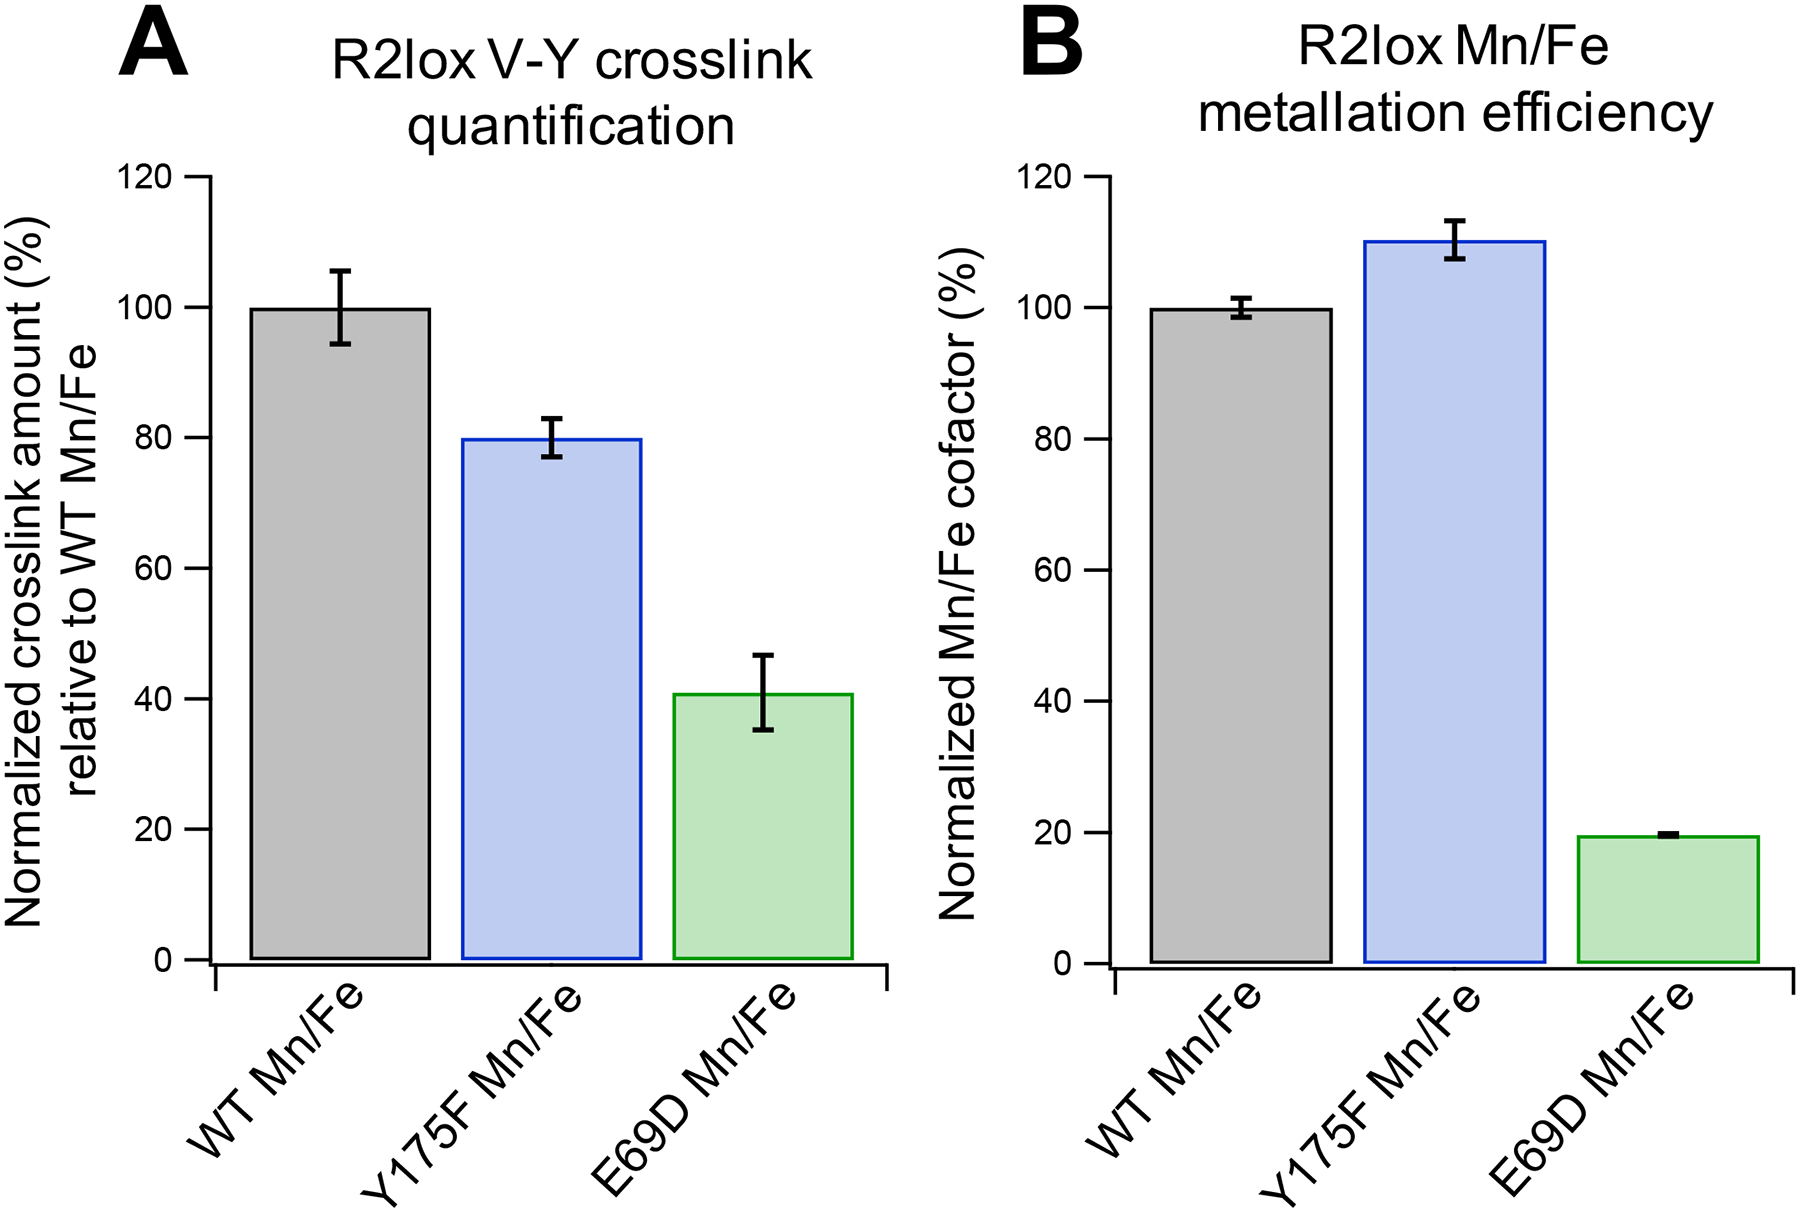
(A) LC-MS analysis of cross-link formation in Mn/Fe WT R2lox compared to Y175F and E69D mutants. Values are from the integrated chromatographic peak areas of the cross-linked peptide AVTLDAVIRAATVYNMIVE, normalized to the R2lox protein area of the respective LC-MS run. Cross-link levels were normalized to average WT values. The error bars represent standard error of mean (SEM) across the 9 runs of each sample type (3 biochemical replicates × 3 technical replicates). (B) MnIII/FeIII cofactor formed in R2lox as determined by EPR spin quantification. Samples were prepared identically to those used in (A). Error bars shown represent SEM across 3 biochemical replicates.