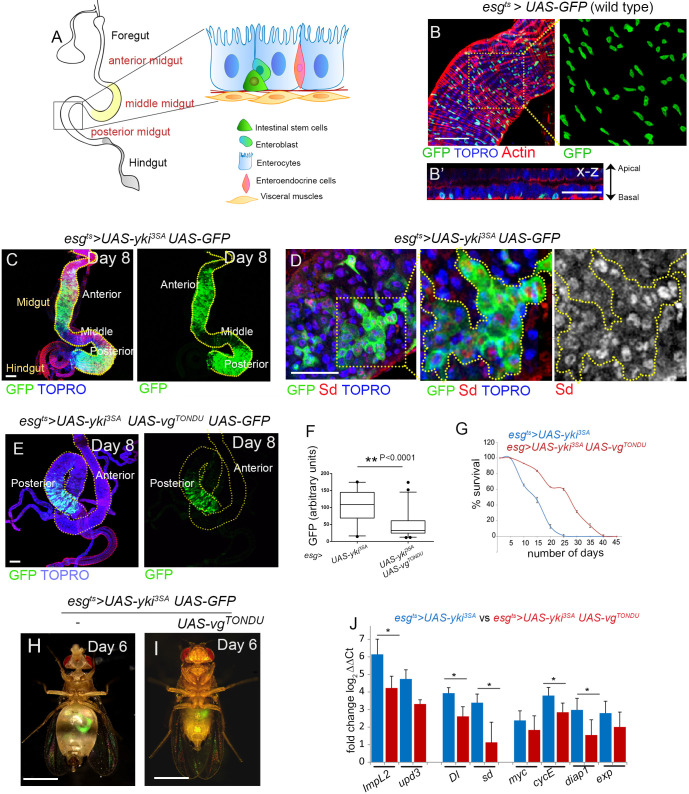
Fig. 1.
Expression of the TONDU peptide inhibits Yki-driven ISC tumors. (A) Schematic representation depicting the different cell types in the adult Drosophila gut. (B,B′) esgts>UAS-GFP labels ISCs in the Drosophila midgut. (B) ISCs (marked by GFP) are interspersed throughout the gut. Overlying muscles are marked with F-Actin (red). (B′) X-Z section displaying basally located ISCs (GFP). (C) esgts>yki3SAUAS-GFP gut shows an increase in ISC numbers. (D) esgts>yki3SAUAS-GFP tumors show increase in Sd level. (E) Decrease in ISCs (marked by GFP) in the anterior and posterior midgut of esgts>yki3SA UAS-vgTONDU flies that co-express the TONDU peptide. (F) Quantification of GFP in TONDU-expressing and non-expressing esgts>yki3SAguts. Box plots indicate the median (horizontal lines), 25th and 75th percentiles (box), and 2.5 to 97.5 percentile range (whiskers). Outliers are displayed as filled circles. Significance displayed as P-value, for unpaired Student's t-test. (G) Increase in survival of esgts>yki3SAUAS-vgTONDU flies compared to esgts>yki3SA (n=50 each genotype). (H) Abdominal bloating in esgts>yki3SAUAS-GFP flies as seen on day 6 after tumor induction (n=19/25 are bloated). (I) esgts>yki3SA UAS-vgTONDU UAS-GFP flies display delay in bloating (n=14/25 are not bloated) as seen on day 6. (J) qPCR displaying the decrease in mRNA levels of candidate genes in TONDU-expressing flies. Data presented as mean±s.e.; *P≤0.025 for Student's t-test. Scale bars: 100 µm (B,C,E), 50 µm (B′,D), 1 mm (H,I).

