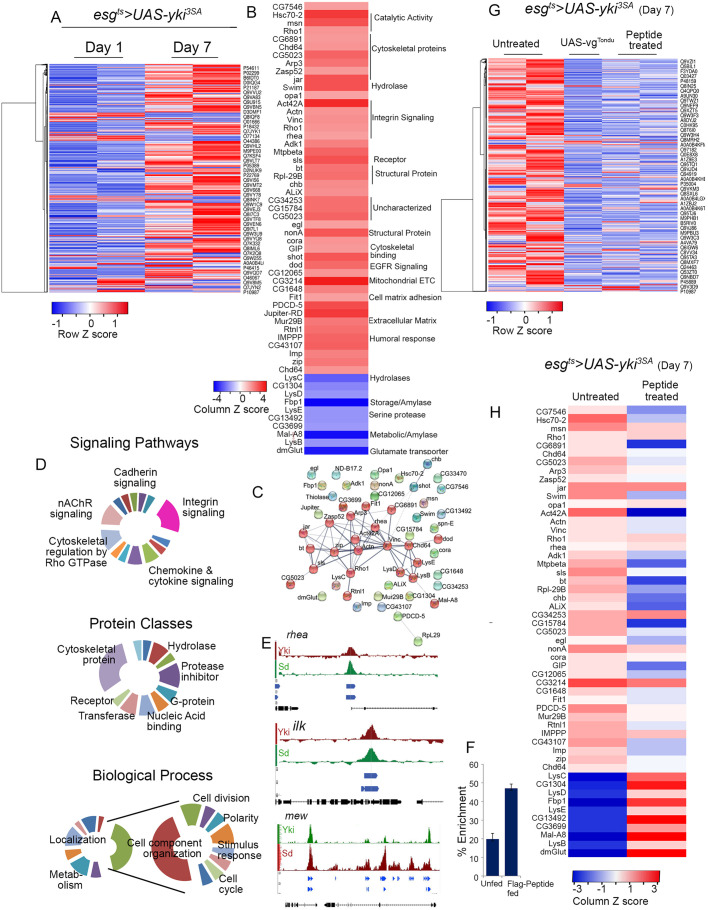
Fig. 3.
Comparative proteomic analysis of Yki-driven ISC tumors and tumors inhibited by the TONDU peptide. (A) Heat map displaying changes in protein levels in day 7 and day 1 esgts>yki3SA tumors. (B) 55 differentially (>±2 log2fold, P=0.05) expressed proteins in day 7 esgts>yki3SA tumors. (C) Protein-protein interaction (PPI) network of enriched proteins (>log2 2 fold) in esgts>yki3SA tumors generated with STRING (Szklarczyk et al., 2019), representing 55 nodes and 63 edges (PPI enrichment P<0.0001). (D) Different GO classes identified by PANTHER (Mi et al., 2007) in differentially expressed proteins between esgts>yki3SA day 7 versus day 1 tumor proteome. (E) Sd and Yki binding sites in the regulatory regions of select integrin pathway members as determined in Nagaraj et al. (2012). (F) Percentage enrichment for Sd binding upstream of mew (αPS1) inferred by ChIP with anti-FLAG antibody. (G) Heat map displaying the effect of TONDU peptide on esgts>yki3SA tumor proteome. (H) Heat map displaying change in levels of protein (>±2 fold in day 7 tumors) upon TONDU peptide treatment.

