Fig. 4.

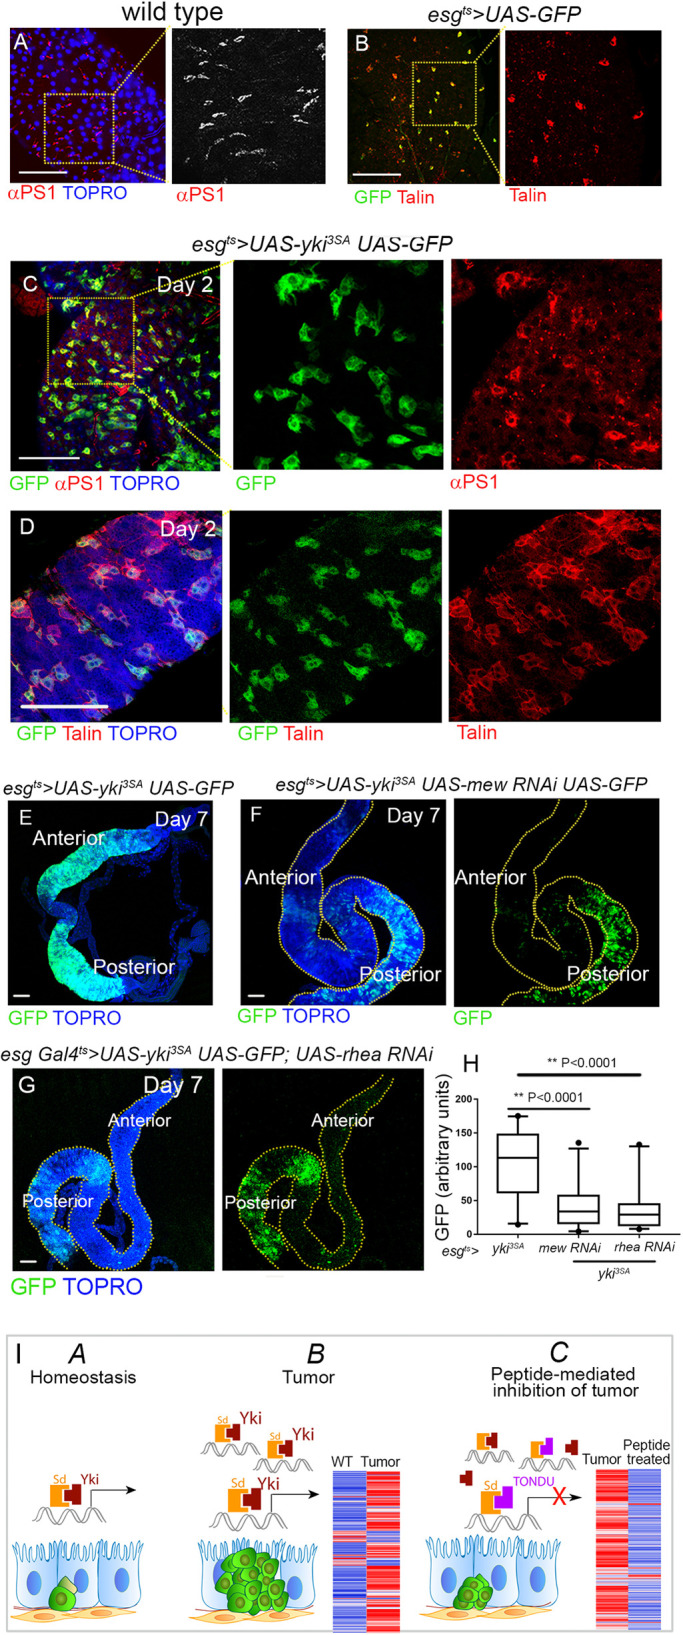
Loss of integrin signaling inhibits growth of Yki-driven ISC tumors. (A,B) αPS1 (A) and Talin (B) staining in esgts>UAS-GFP marked ISCs. (C,D) Overall increase in αPS1 (C) and Talin (D) in esgts>yki3SA tumors. (E-G) Inhibition of Yki-driven tumors upon simultaneous downregulation of αPS1 (esgts>yki3SA UAS-mew-RNAi, n=9; F) or Talin (esgts>yki3SA UAS-rhea-RNAi, n=9; G), when compared to similarly aged esgts>yki3SA tumors (E and Fig. S5A, respectively). (H) Quantification of GFP from E, F and G. Box plots indicate the median (horizontal lines), 25th and 75th percentiles (box), and 2.5 to 97.5 percentile range (whiskers). Outliers are displayed as filled circles. Significance displayed as P-values, for unpaired Student's t-test. (I) Schematic of Yki-Sd mediated transcription in wild-type (WT) guts (A), in Yki-driven tumor (B) and in Yki-driven tumor in the presence of the TONDU peptide (C). Scale bars: 100 µm.
