Fig. 4.
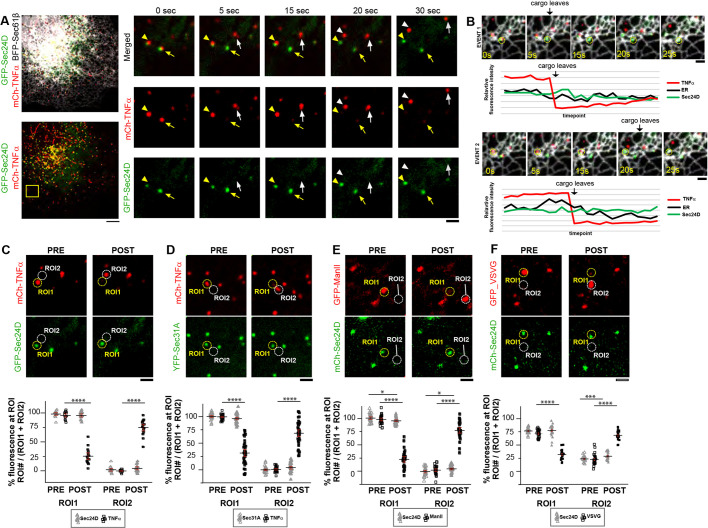
COPII components remain associated with the ER as cargo is exported. (A) COS-7 cell expressing mCh-TNF RUSH (red), GFP-Sec24D (green) and BFP-Sec61β (gray). Right: Time-lapse image of two events (from within yellow box) where fluorescently marked cargo (red) is observed leaving COPII fluorescent puncta (green) on the ER (gray) at the indicated time points following biotin addition. Arrows mark the first trafficking event and the arrowheads mark a second event. COPII is marked with a yellow arrow/head in each frame and the location of cargo as it traffics is marked with white. (B) Sec24D, TNF cargo and ER fluorescence was monitored over 2 min within an ROI (yellow circle) that marks the original site of cargo release. Graphs plot the relative fluorescence intensity and reveal that the ER and Sec24D fluorescence levels remain in the circle even after the cargo leaves. (C) As in A, for several events, the coat and cargo fluorescence was measured in pre and and post cargo leaving frames. Circles mark where fluorescence measurements were made. ROI1 is the site from which cargo is released and ROI2 is the site where cargo traffics to. Fluorescence at each region for each marker was background subtracted and the percentage fluorescence at each ROI calculated pre and post cargo leaving (****P<0.0001). (D) As in C for TNF cargo and YFP-Sec31A (****P<0.0001). (E) As in C for GFP-ManII cargo (****P<0.0001) and mCh-Sec24D (*P=0.03). (F) As in C for GFP-VSVG (****P<0.0001) and mCh-Sec24D (***P=0.0004 in ROI2). Error bars represent s.e.m. Scale bars: 5 µm (A); 1 µm (insets in A; B-F).

