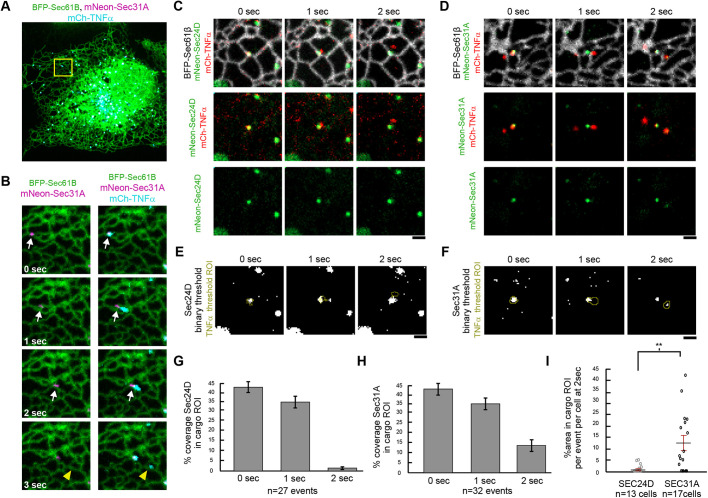
Fig. 5.
Rapid time-lapse imaging of release suggests cargo is extruded not uncoated. (A) Representative example of COS-7 cell expressing BFP-Sec61β, mNeon-31A and mCh-TNFα. (B) Time-lapse images of zoomed inset (yellow box in A) demonstrating COPII and cargo dynamics with 1 s time frames. White arrows track combined movement of ER associated cargo and COPII components. The yellow arrowhead tracks release of cargo from the COPII component. (C,D) Post biotin cargo release event in a COS-7 cell expressing BFP- Sec61β, mCh-TNF RUSH (red) and either mNeon-Sec31A (green; C) or mNeon-Sec24D (green; D). (E,F) Cargo signal was thresholded and converted to binary to create the cargo ROI (yellow outline). To capture any low signal of COPII/Sec protein fluorescence leaving the ER, the Sec31A or Sec24D images were also thresholded and converted to binary. (G) Percentage of Sec24D coverage in the cargo ROI was calculated at 0, 1 and 2 s. (H) As in G but for Sec31A coverage. (I) For the 2 s time point where cargo has completely moved from the ER, the percentage coverage of the cargo ROI per event was measured and this was further averaged per cell to compare Sec24D with Sec31A (1.2%, 13 cells, 27 events versus 12.3%, 17 cells, 32 events), Student's t-test (**P=0.003). Error bars represent s.e.m. Scale bars: 1 µm.

