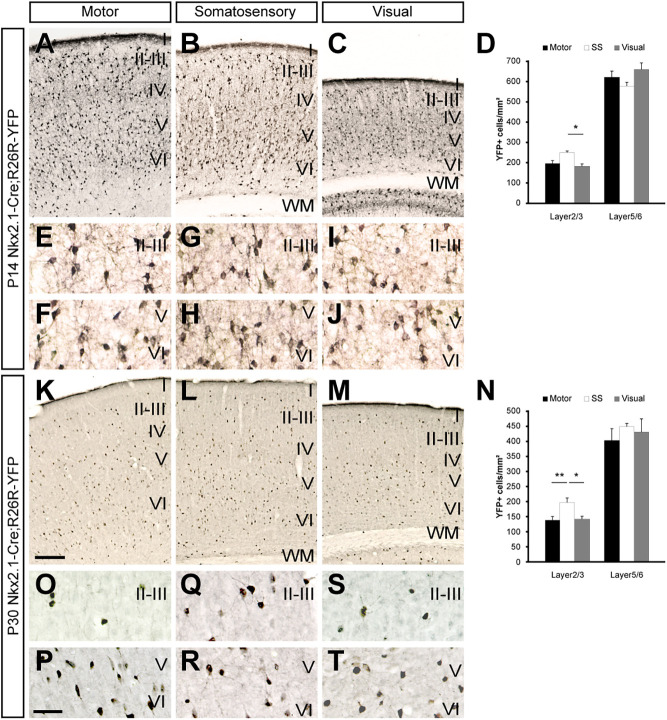
Fig. 3.
MGE-derived CIN density varies along and throughout the cerebral cortex. Coronal sections through the motor (A,K), somatosensory (B,L) and visual (C,M) cortex of P14 (A-C) or P30 (K-L) Nkx2-1-Cre; R26R-YFP mice showing the distribution of YFP-expressing cells after YFP staining. (E-J) High-magnification images of the motor (E,F), somatosensory (G,H) and visual (I,J) P14 cortex in the supragranular (E,G,I) or infragranular (F,H,J) layers. (D) Quantification of the distribution of YFP-expressing cells in motor (black bars), somatosensory (white bars) and visual (gray bars) cortex (layer 2/3: motor, 194.62±15.01 cells/mm2; somatosensory, 249.29±7.08 cells/mm2; visual, 180.73± 12.49 cells/mm2, P=0.004; layer 5/6: motor, 621.06± 30.29 cells/mm2; somatosensory, 576.75±19.27 cells/mm2; visual, 659.06±32.28 cells/mm2, P=0.08, n=5). (O-T) High-magnification images of the motor (O,P), somatosensory (Q,R) and visual (S,T) P30 cortex in the supragranular (O,Q,S) or infragranular (P,R,T) layers. (N) Quantification of the distribution of YFP-expressing cells in motor (black bars), somatosensory (white bars) and visual (gray bars) cortex (layer 2/3: motor, 137.95± 12.78 cells/mm2; somatosensory, 196.39±15.35 cells/mm2; visual, 141.31±9.84 cells/mm2, P=0.0005; layer 5/6: motor, 402.33±38.32 cells/mm2; somatosensory, 446.98±10.55 cells/mm2; visual, 429± 43.48 cells/mm2, P=0.55, n=4). *P<0.05, **P<0.01 (rANOVA test). Histograms show the mean±sem. I-VI, cortical layers I-VI. Scale bars: (in K) 200 µm in A-C,K-M; (in P) 50 µm in E-J,O-T.

