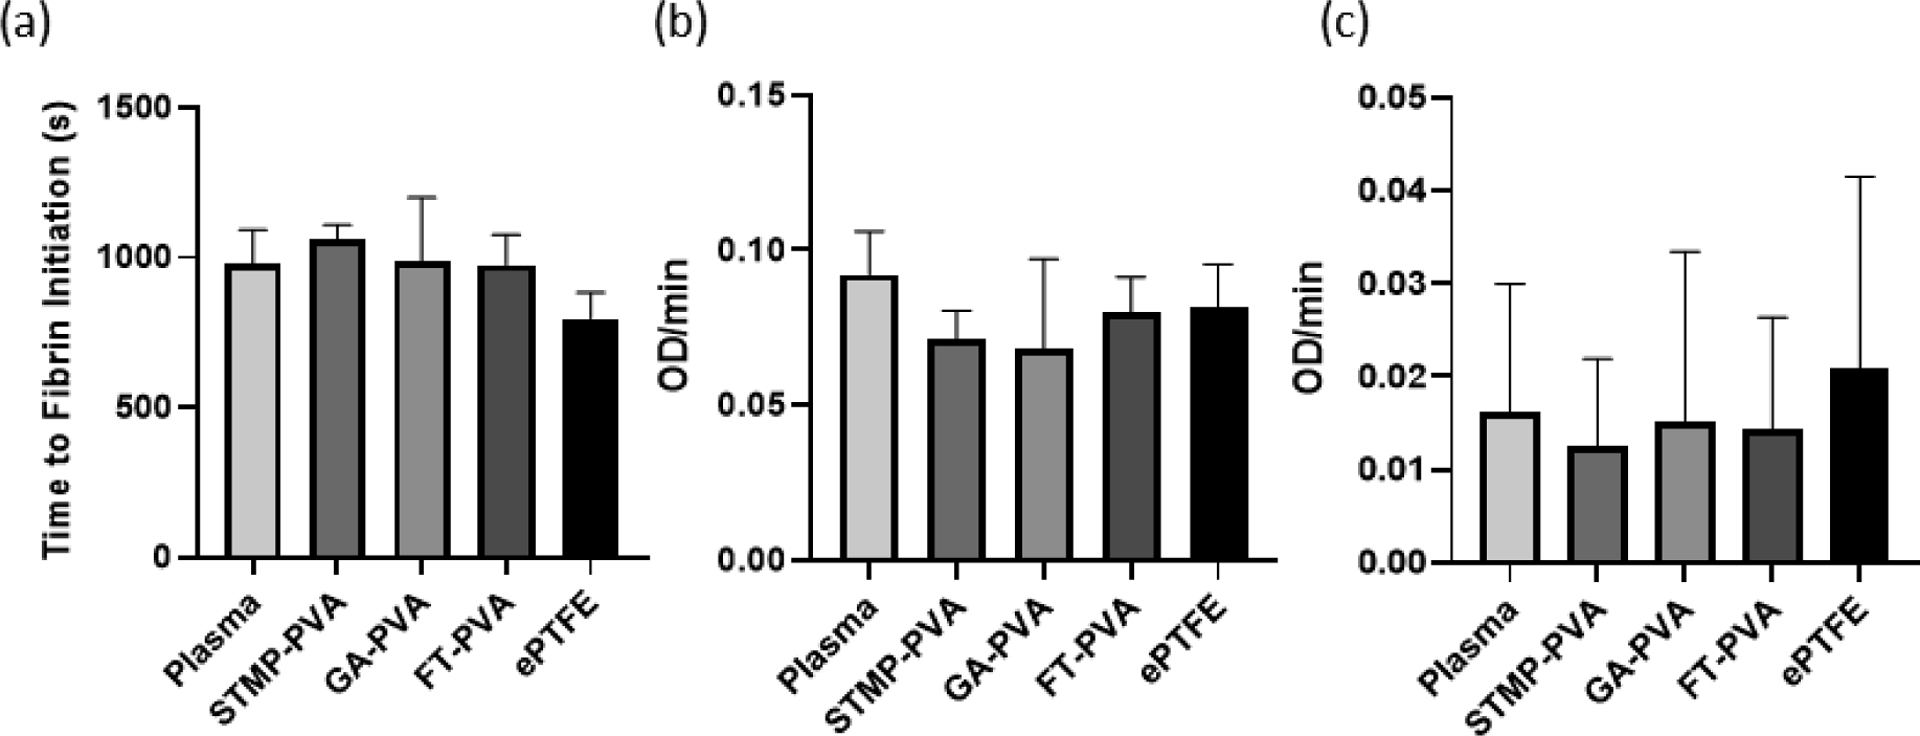
Figure 2.

Fibrin formation dynamics in the presence of biomaterials. (a) Fibrin initiation time on crosslinked PVA hydrogels. (b) Rate of fibrin generation on biomaterials shown as optical density over time (OD/min). (c) tPA induced fibrinolysis in the presence of biomaterials shown as optical density over time (OD/min). The absolute value was taken to make decreasing rates positive for the fibrinolysis data. Data are shown as means ± SD. Statistical analyses were performed using a one-way ANOVA (n=6).
