Figure 4.

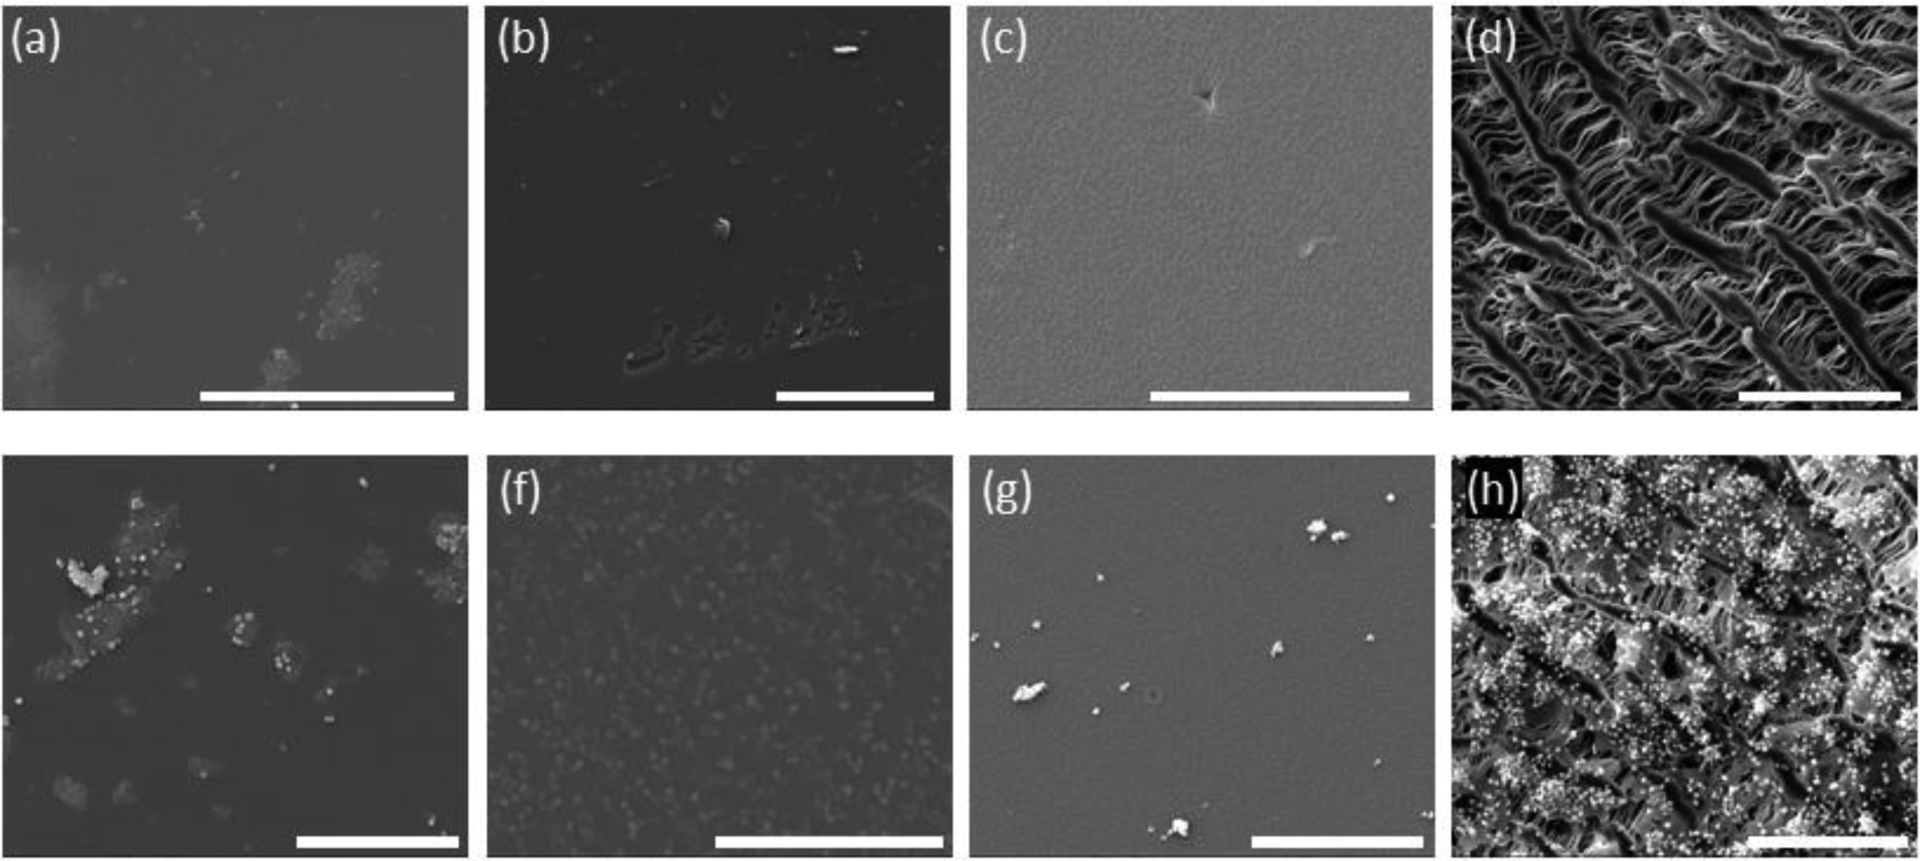
Representative SEM micrographs of each biomaterial before (top row) and after (bottom row) isolated platelet incubation. (a, e) STMP-PVA; (b, f) GA-PVA; (c, g) FT-PVA; and (d, h) ePTFE-PVA. All scale bars = 50nm.

Representative SEM micrographs of each biomaterial before (top row) and after (bottom row) isolated platelet incubation. (a, e) STMP-PVA; (b, f) GA-PVA; (c, g) FT-PVA; and (d, h) ePTFE-PVA. All scale bars = 50nm.