
Figure 3. Predicted interaction network for the 17 genes with recurrent copy number alterations (CNAs) and with EZH2 in Ghanaian invasive carcinomas.
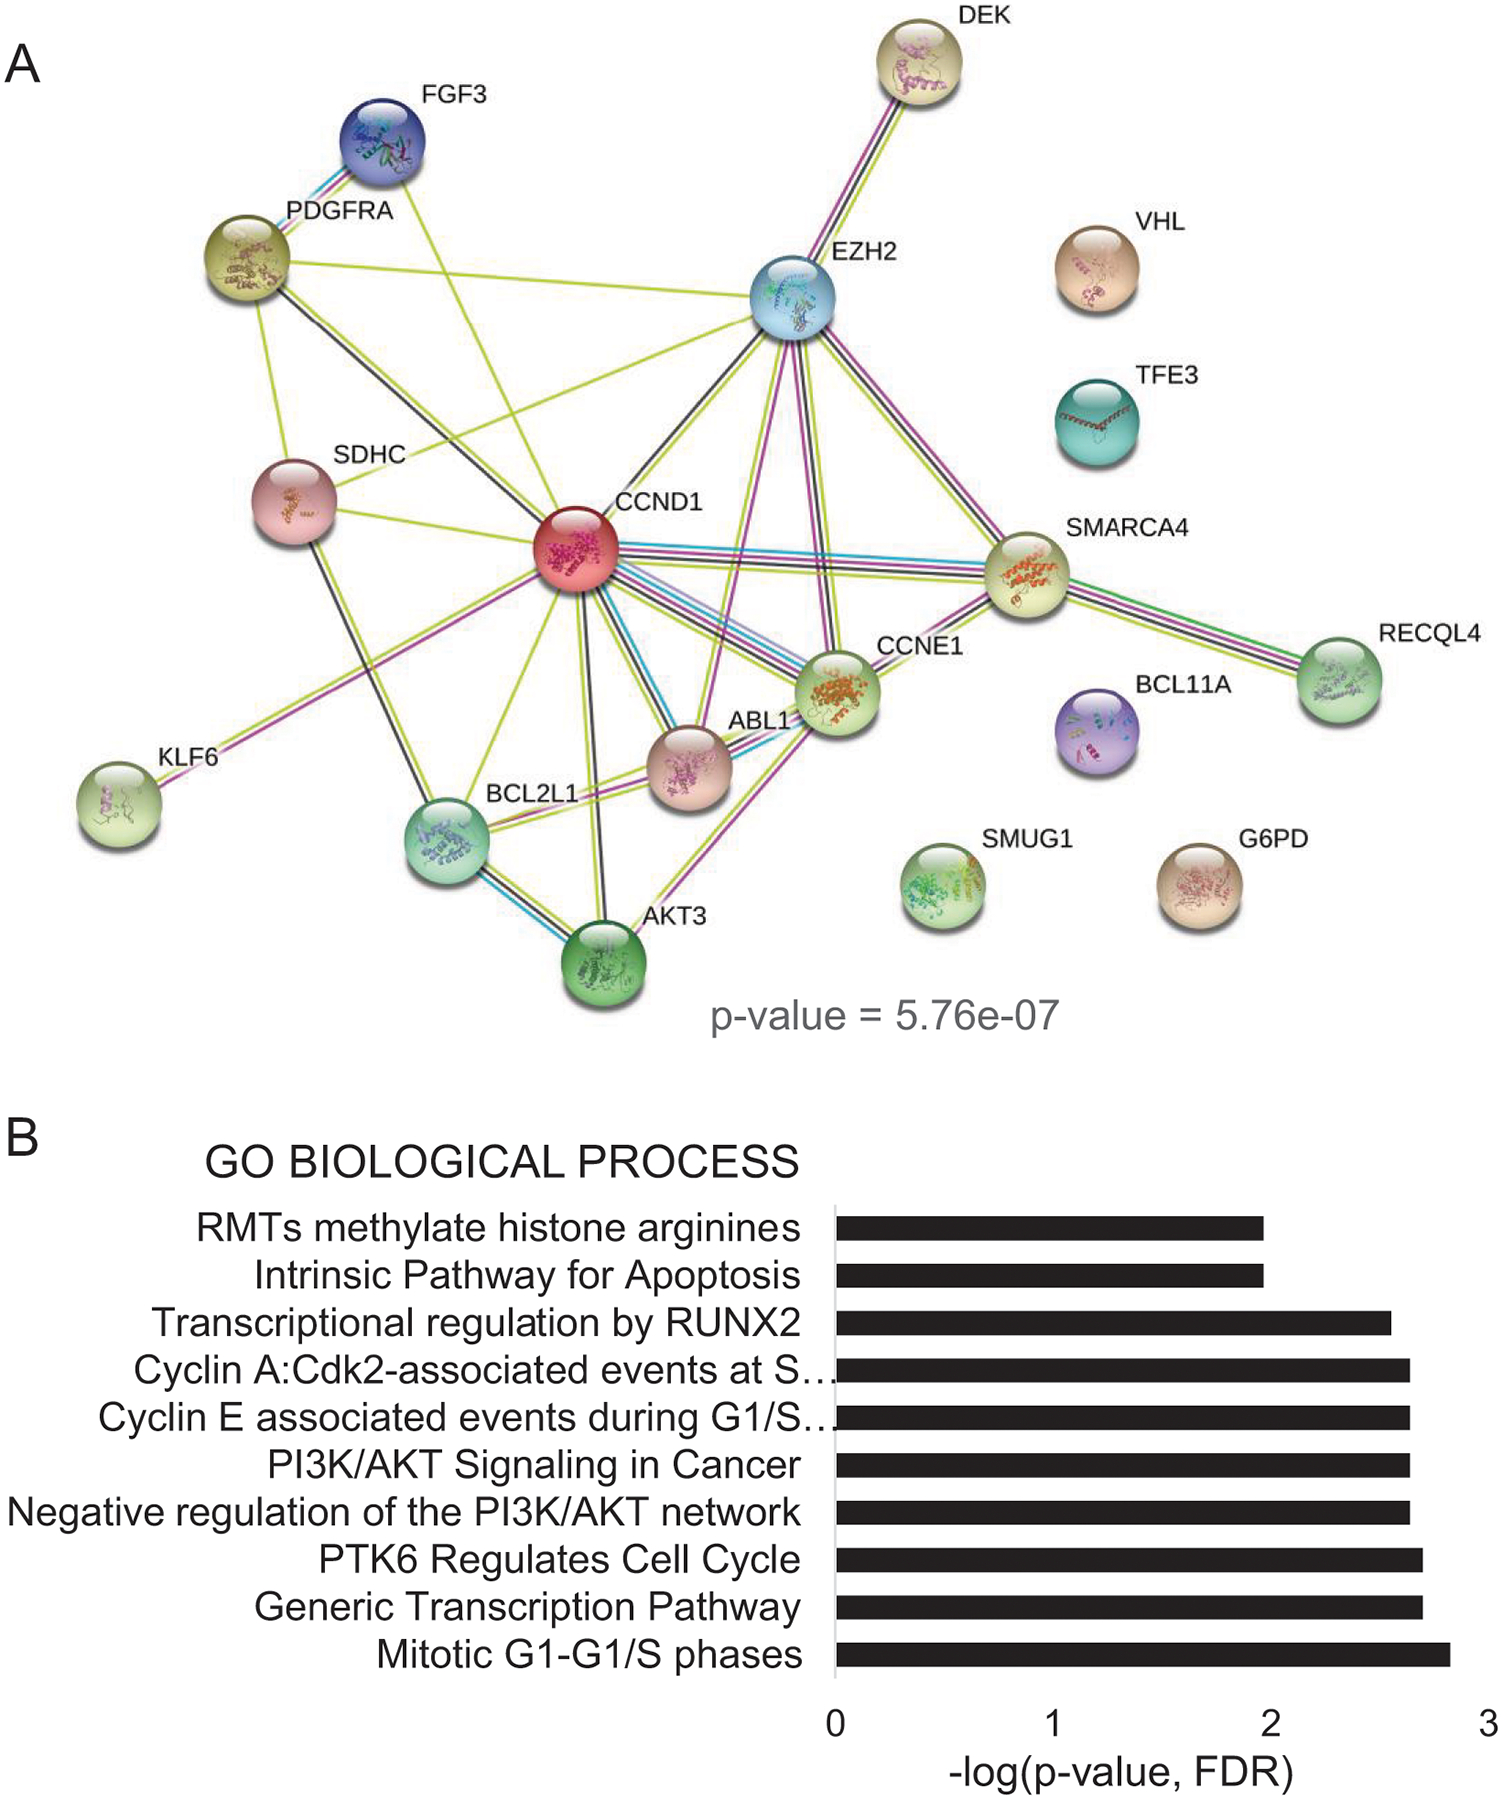
A. Network graph shows enrichment (p-value = 5.7E-07) of topological features of the 17 genes with CNAs. Enrichment analysis in STRING database (v11.0) predicts interactions between EZH2 and 12 of the 17 genes with CNAs (r=0.4 – 0.75). B. Enrichment analyses with biological functions of top 10 altered biological pathways (REACTOME). Legend (bars: -log(p-value)