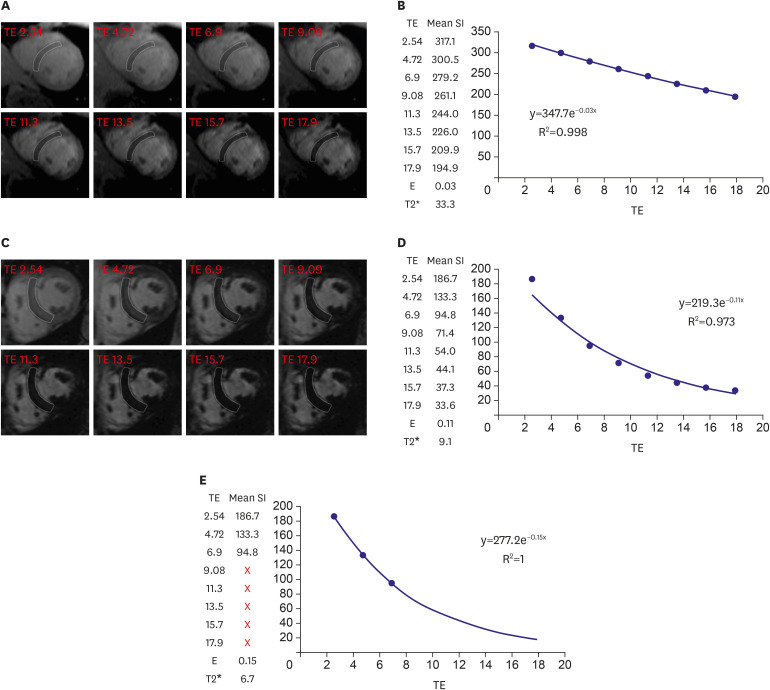
Figure 1. T2* imaging to assess myocardial iron overload. (A) T2* scan of a normal heart showing slow signal loss with increasing TE. (B) Decay curve for normal heart (T2*=33.3 ms). (C) Heavily iron overloaded heart. Note there is substantial signal loss at TE = 9.09. (D) Decay curve for heavily iron overloaded heart showing rapid signal loss with increasing TE. The curve plateaus as myocardial signal intensity falls below background noise. (E) Values for higher TEs are removed (truncation method) resulting in a better curve fit and a lower T2* value. As originally published by BioMed Central in Schulz-Menger et al. Journal of Cardiovascular Magnetic Resonance 2013;15:35.3).
TE = echo time.

