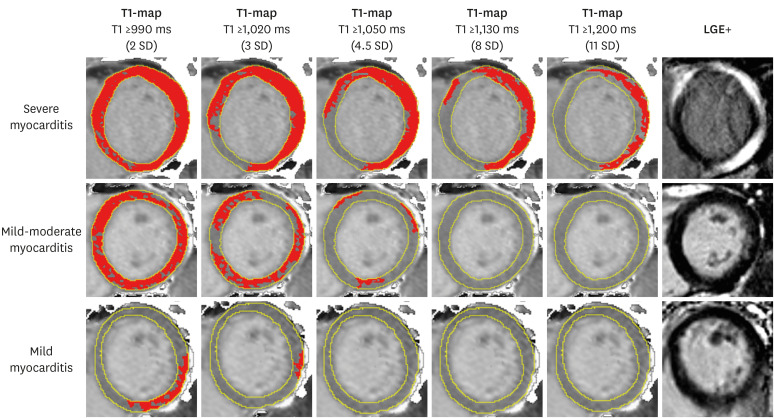
Figure 2. T1-maps using incremental thresholds demonstrate the predominantly non-ischemic pattern of injury across a spectrum of acute myocarditis. Red indicates areas of myocardium with a T1 value above the stated threshold of at least 40 mm2 in contiguous area. T1 threshold of 990 ms was previously validated for the detection of acute myocardial edema; other thresholds were selected for illustrative purposes. As originally published by Biomed Central in Ferreira et al. Journal of Cardiovascular Magnetic Resonance 2014;16:36.4).
LGE = late gadolinium enhancement; SD = standard deviation.

