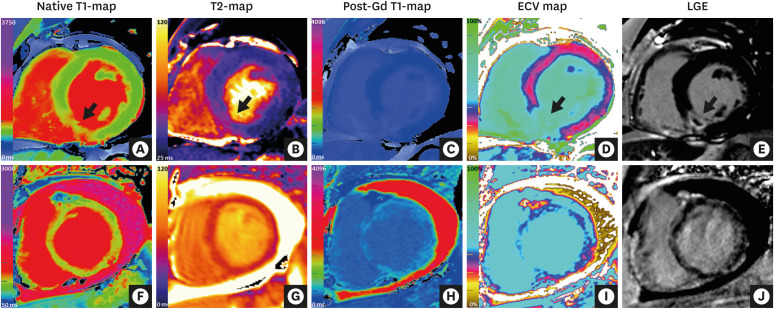
Figure 4. CMR mapping and LGE imaging in acute myocardial pathologies. (Top row) CMR (3 Tesla) images of a patient with an acute myocardial infarction in the inferior septum. (A) Native T1-map (ShMOLLI) showing significantly increased T1 values in the inferior septum (1,407 ms vs. 1,159 ms in remote myocardium in the anterior wall; normal ShMOLLI T1 at 3T = 1,166±60 ms). (B) T2-map showing increased T2 values in the inferior septum (arrow, 55 ms vs. 39 ms in remote myocardium in the anterior wall). (C) Post-gadolinium contrast T1-map. (D) ECV map showing significantly increased ECV in the inferior septum (59% vs. 30% in remote myocardium in the anterior wall). (E) LGE imaging showing transmural enhancement with a core area of microvascular obstruction in the inferior septum (arrow). (Bottom row) CMR (1.5 Tesla) images of a patient with acute myocarditis. (F) Native T1-mapping using the ShMOLLI method showed significantly increased global myocardial T1 values (1,060 ms; normal ShMOLLI T1 at 1.5T = 962±25 ms). (G) T2-map showed increased global myocardial T2 values (59 ms), consistent with edema. (H) Post-gadolinium contrast T1-map. (I) ECV mapping showed increased global ECV of 36% (normal 27±3%). (J) LGE imaging showed small areas of patchy enhancement in a non-coronary distribution.
CMR = cardiovascular magnetic resonance; ECV = extracellular volume; LGE = late gadolinium enhancement; ShMOLLI = shortened modified Look-Locker inversion recovery.

