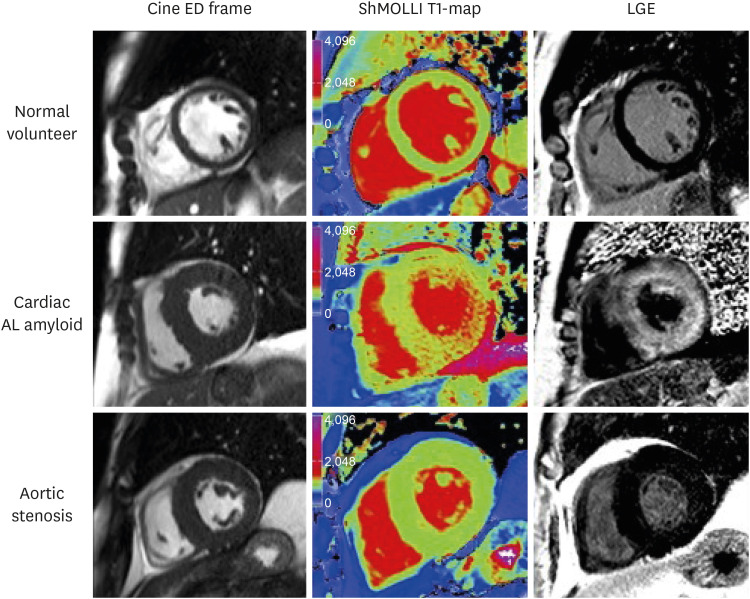
Figure 5. Characteristic examples from CMR scans. CMR end-diastolic frame from cine (left panel), ShMOLLI non-contrast T1 map (middle panel), and LGE images (right panel) in normal volunteer, aortic stenosis patient, and cardiac amyloid patient. Note the markedly elevated myocardial T1 time in the cardiac amyloid patient (1,170 ms, into the red range of the color scale) compared to the normal control (955 ms) and the patient with aortic stenosis and left ventricular hypertrophy (998 ms). As originally published in Karamitsos et al. JACC: Cardiovasc Imaging 2013;6:488-97.17).
AL = amyloid light chain; CMR = cardiovascular magnetic resonance; ED = end diastolic; LGE = late gadolinium enhancement; ShMOLLI = shortened modified Look-Locker inversion recovery.

