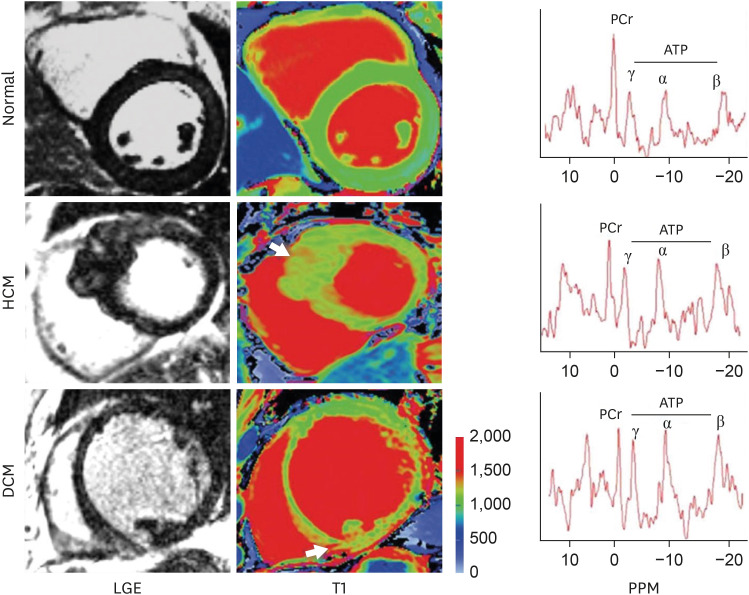
Figure 6. LGE and T1 images in normal, HCM, and DCM. Arrows point to focal areas of LGE and high T1. Note: There is diffusely high T1 in the septum of HCM and inferior septum/inferior in the DCM. Representative spectra for each condition are shown; PCr indicates phosphocreatine; and ATP adenosine triphosphate. As originally published in Dass S. et al. Circulation Cardiovascular Imaging 2012;5:726-33.30).
ATP = adenosine triphosphate; DCM = dilated cardiomyopathy; HCM = hypertrophic cardiomyopathy; LGE = late gadolinium enhancement; PCr = creatine phosphate.

