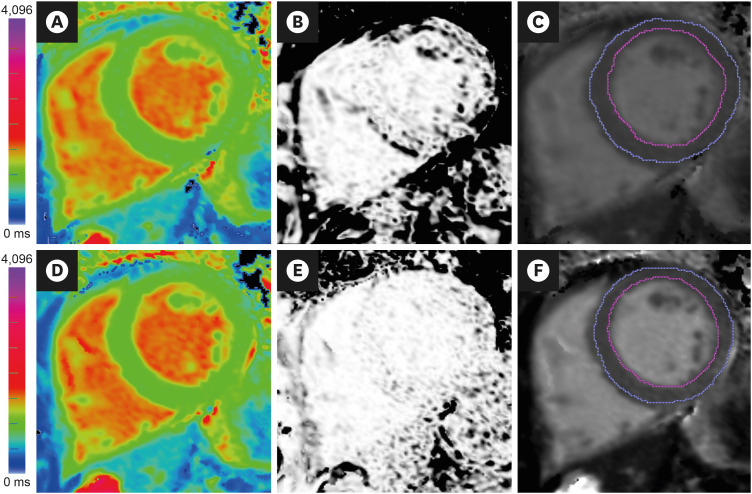
Figure 8. Image analysis of T1-maps. (A) Native T1-map (ShMOLLI at 1.5 Tesla). The acquisition of this T1-map suffered from breathing motion, resulting in (B) an R2 map that showed poor T1 fit (black pixels within the LV myocardium) and (C) underestimated average LV myocardial T1 values (T1=928 ms) after myocardial segmentation using epi- and endo-cardial contours (blue and magenta lines). Guided by the suboptimal R2 map, the operator repeated the acquisition with the patient performing a good breath-hold, which produced (D) A good quality native T1-map, as indicated by (E) an R2 map that showed good T1 fit (pixels within the LV myocardium are white), and (F) accurate average LV myocardial T1 values (T1=943 ms). Ensuring good data fit during image acquisition and analysis is paramount in the clinical application of mapping techniques.
LV = left ventricular; ShMOLLI = shortened modified Look-Locker inversion recovery.

