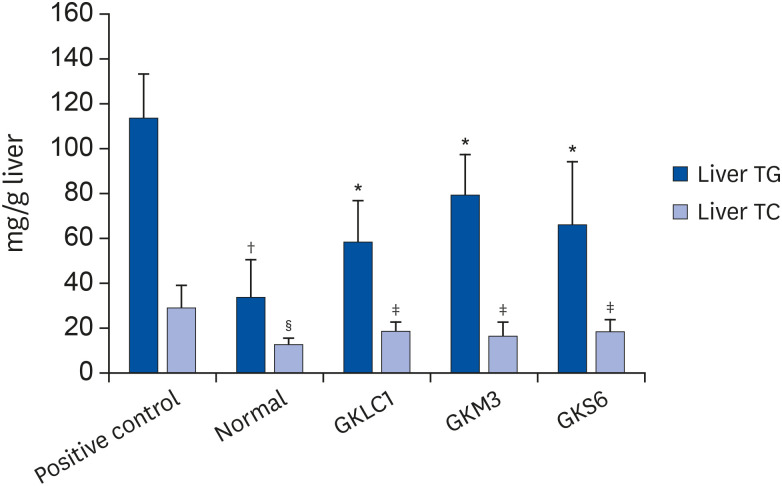
Fig. 3. Effects of probiotics GKLC1, GKM3, and GKS6 on liver TG and TC in ethanol-fed C57BL/6 mice. Each value is represented as the mean ± SD (n = 6). Duncan's multiple range test was applied.
TG, triglyceride; TC, total cholesterol; GKS6, Lactobacillus paracasei GKS6; GKM3, Lactobacillus plantarum GKM3; GKLC1, Lactobacillus rhamnosus GKLC1.
*P < 0.05, †P < 0.01, ‡P < 0.05, §P < 0.01 compared to the positive control.

